Brooks: Why Economy Likely Won’t Impact Strong Housing
Originally Published by: LBM Exec by Greg Brooks — March 29, 2022
SBCA appreciates your input; please email us if you have any comments or corrections to this article.

No, not that helter skelter. Charles Manson lifted the term from Paul McCartney, who used it as a metaphor for a turbulent romance.
McCartney got it from an amusement park. Multi-story slides were originally called helter skelters to hype them up as the ultimate wild ride—which they probably were back in 1905.
Their modern descendants are considerably wilder, and a pretty good metaphor for the U.S. housing market right now.
Everyone knows that the invasion of Ukraine is damaging the global economy. Our pain is peanuts compared with what the Ukrainian people are going through, but it doesn’t mean we’re having fun. In February the Consumer Price Index (CPI-U) was up 7.9% YoY. Food prices were up 22% YoY while gas prices were up nearly 50%.
But the larger driving force is housing. As of December, home resale values were up 18.3% YoY while asking rents were up 16.7%, according to John Burns Real Estate Consulting (JBREC).
Last week the Federal Reserve signed off on a 0.25% increase in the benchmark interest rate, its first hike in over three years. At the moment, six more rate hikes are in the works for this year, possibly followed by another three in 2023.
Whether or not the result will be a recession is pure guesswork—and, of course, second-guesswork. Yes, we can expect the economy to cool down; that’s the whole point. If the Fed manages to back off at just the right moment, we’ll land in the Goldilocks zone. If not, every Monday morning quarterback on the planet will howl.
But even if the economy does go into recession, that’s no guarantee housing will follow—we powered through the 2001-02 dot-com crash with barely a scratch. On the other hand, it only makes sense that there’s a tipping point somewhere. The question is how close we are to that point.
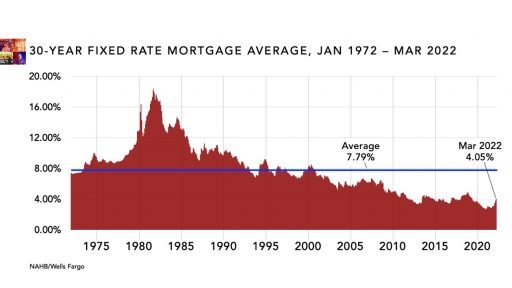
Even without the bump in the federal funds rate, interest on the average 30-year conventional mortgage has risen from 2.9% in September to 3.92% so far in March. Analyst Ian Shepherdson says that “has increased the cost of a monthly mortgage payment for a median-priced home by more than $400, or 27%.”
Existing home sales were 6.02 million annualized in February, down 7.2% from January and down 2.4% YoY. Shepherdson believes the sales rate will fall to 4.5 million by the end of the summer.
On the other hand, JBREC believes we still have room to maneuver. Its analysts looked at mortgage payment-to-income ratios from 1985 to 2020 in 33 major U.S. metro markets. Over that 35-year period, the median was slightly above 30%.
Today the ratio is pushing 40%, but in the past it has been as high as 48%. Only two markets are below their long-term median (New York and Chicago), but just four of the 33 are at or near their 35-year peak: Nashville, Salt Lake City, Tampa, and San Jose.
In the other 27, the ratio is elevated but still well below the peak, which suggests that mortgage payments still have room to rise without killing demand.
Suppliers are concerned primarily with the new home market—that’s where most of their volume comes from. New home sales are also the canary in the coal mine for buyer since the prices are higher. If buyers are still buying new homes, the market is probably on solid ground.
New home sales also slipped a little in February. 772,000 annualized was down 2% vs. January and down 6.2% YoY. But that all looks pretty normal. We’ve seen bigger February dips than that due to snowstorms.
Even so, NAHB CEO Jerry Howard recently told Fox Business that we’re “staring into the face of the perfect storm” of inflated prices, costly regulation, and rising interest rates. “Our own Wells Fargo NAHB Housing Market Index (HMI) declined three points this month because builders are saying things are going to dry up.”
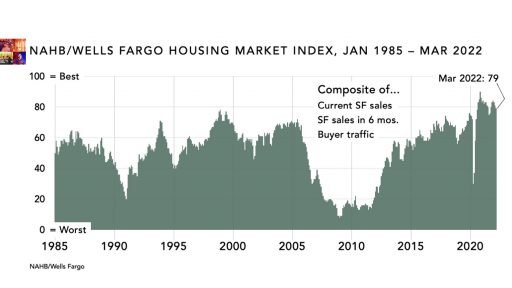
Maybe they will dry up. Or maybe this is why NAHB has just a bit of a reputation for hyperbole. The HMI fell from 82 in February to 79 in March. That’s still higher than any pre-COVID reading in the 37-year history of the index.
The HMI is a mood ring: a subjective measure of builder optimism or pessimism. That’s not to say it has no value, but anything people say right now is speculation. Russia invaded Ukraine on February 24th, so we won’t see any tangible economic impact until the March data at the earliest.
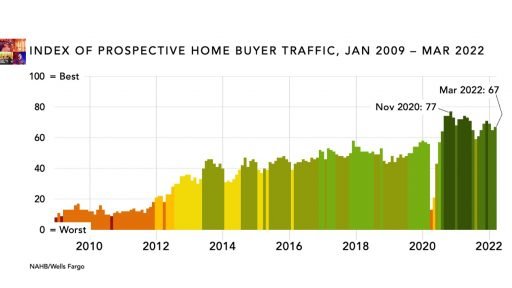
But the HMI survey was conducted in early March, so it’s more current than any February numbers. And maybe more optimistic—prospective buyer traffic is one component of the index, and it actually rose this month. At 67, it’s just ten points below the all-time record set in late 2020.
JBREC has actual numbers, but they’re February numbers so take them for what they’re worth. They do support the HMI, though.
JBREC measures buyer demand by counting the number of unsold finished units in new home communities. During the 12 months before COVID hit, the average was roughly 1.5 to 2.0 homes per subdivision. In Feb 2022, it was 0.25.
Yeah, you read that right: The typical new home buyer today will need to visit four subdivisions just to find a single finished home that hasn’t already been sold.
On top of everything else, the psychological climate favors housing. The Ukraine war plus our ongoing whack-a-mole game with new COVID variants have created as much uncertainty as anyone could ask for short of World War III (which some think is also in play).
Uncertainty motivates people to seek shelter. That may explain why the University of Michigan Consumer Sentiment Index—another mood ring—fell to a near record low of 59.4% in March while home buyer demand is near an all-time record high by multiple metrics.
Whatever the reason, we’ll take it. There’s just one catch.
One thing no one is worried about right now is housing starts. February looked fine: 1.769 million was the highest annualized rate since June 2006. Some analysts—JBREC included—think the annualized rate could crack the 2.0 million mark at least once or twice this year.
The problem is getting those homes built. Under normal conditions, the build cycle for a mid-sized production home is roughly 15 to 18 weeks depending on where you are. In 2021, the combination of labor constraints plus supply chain bottlenecks added an average of nine weeks to the build cycle, says JBREC.
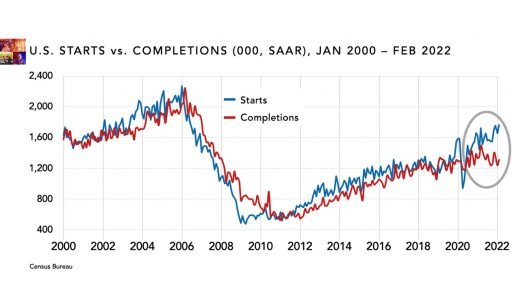
Starts and completions normally move in sync—starts are a little higher when the market is strong while completions take the lead when it goes soft. But ever since the pandemic hit, completions have been falling further and further behind.
A builder’s monthly overhead expenses stay the same whether it take four months or six to get homes built, so slowdowns can have a big impact on profit. They don’t hurt dealers’ revenue, but sales projections are difficult if not impossible when each task in the construction process keeps getting pushed back.
Nor does it appear that it’s going to get better anytime soon. Labor has been an issue for years now, and with U.S. population growth slowed to almost zilch, it’s not likely to get easier to get young workers interested in construction careers (or, for that matter, careers in LBM).
The pandemic was the original culprit behind our screwed-up global supply chain, and the war in Ukraine will only make things worse. A year ago, experts thought housing inventory might be back to normal levels by the end of 2022. Now they’re saying late 2024 at the earliest.
The good news is that housing demand is strong and there are no signs that it won’t stay that way. The next few years are likely to be a bumpy ride, though, and there is not much to do about it except choose your partners carefully and stick together.