Charts: Lumber and Steel Costs Set Record Highs
Originally Published by: NAHB — May 13, 2021
SBCA appreciates your input; please email us if you have any comments or corrections to this article.
Prices paid for goods used in residential construction ex-energy rose 1.7% in April (not seasonally adjusted) and have increased 12.4% over the past 12 months, according to the latest Producer Price Index (PPI) report released by the Bureau of Labor Statistics. Building materials (i.e., inputs to residential construction less food and energy) prices have declined just twice since December 2019.

- ADVERTISEMENT -

The index for inputs to residential construction, including food and energy, increased less (+1.3%) as the index for final demand energy declined 2.4% over the month.
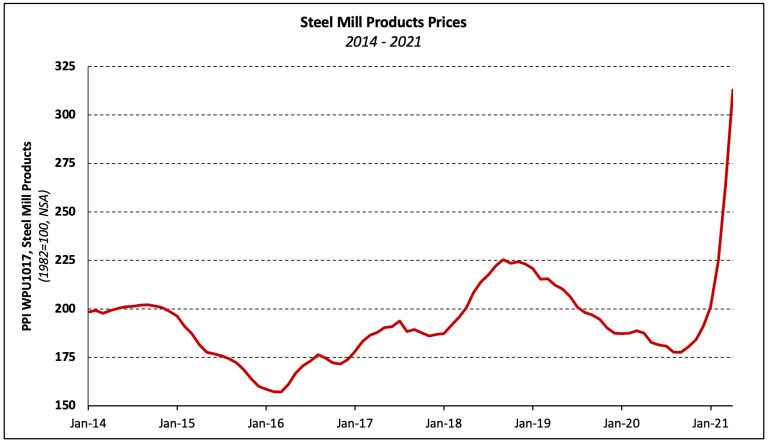
Steel mill products prices climbed 18.4% in April following a 17.6% increase in March. Prices are up 55.6%, year-to-date, and the month-over-month percentage increase set a record high for the third month in a row. Steel mill products price volatility is greater than it has been at any time since the Great Recession.
Over the past three months, prices have climbed 22.0%. Perhaps more concerning than rising prices is that the pace of price changes has quickened each of the past nine months.
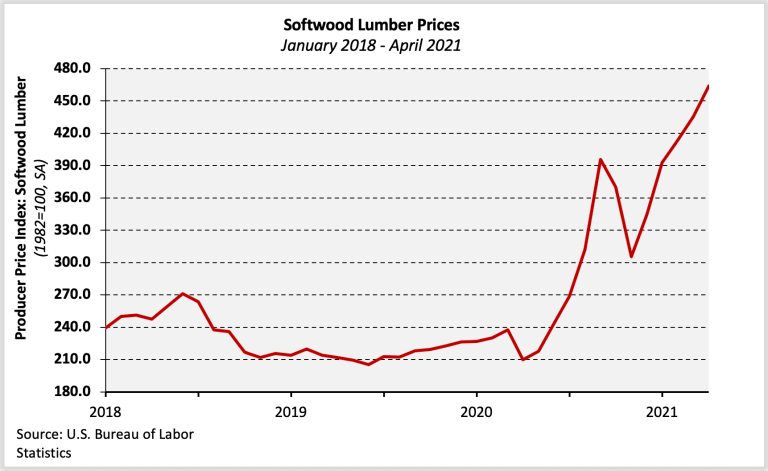
Prices paid for softwood lumber (seasonally adjusted) rose 6.5%, setting a new record high for the third consecutive month. Lumber prices have remained extremely volatile since the 88.5% increase between April and September 2020. Since falling 22.9% between September and November, the softwood lumber PPI has risen 52.0%.
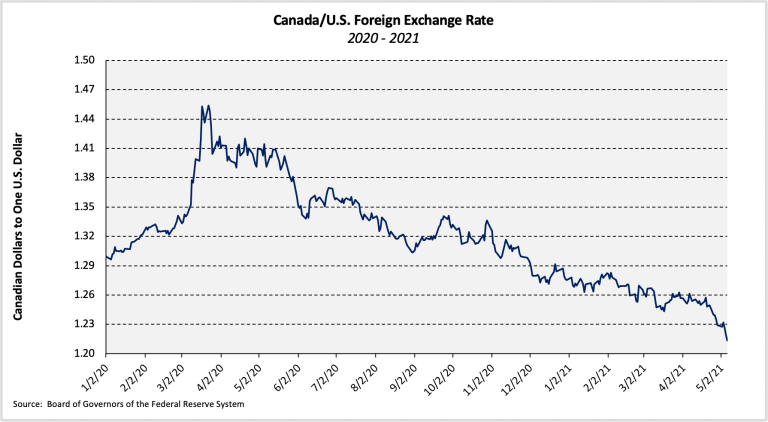
In addition to nominal price movements and tariffs on Canadian lumber, cross-border purchasers are affected by the strength of the U.S. dollar relative to the Canadian dollar. The USD has depreciated 5.0%, year-to-date, and 13.1% over the past 12 months.
Prices paid for gypsum products increased 4.4% in March bringing the two-month increase to 6.6%. The PPI for all gypsum products has increased 12.5% over the past 12 months while the index for gypsum building materials (e.g., drywall) is up 13.3%.

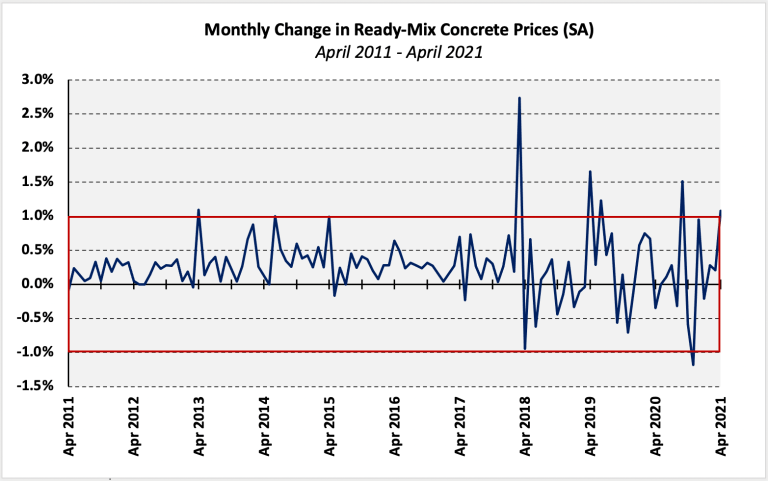
Prices paid for ready-mix concrete (RMC) climbed 1.1% (seasonally adjusted), following a 0.2% increase in February. RMC prices have exhibited unusual volatility since early 2018. increasing or decreasing by 1.0% or more five times during the period. Since January 2000, RMC prices have moved by 1.0% or more 26 times and five have been over the past three years.
Prices increased in all four regions from March to April, up 2.8%, 2.0%, 0.8%, and 0.8% in thes Northeast, West, South, and Midwest, respectively. The index increased the most in the Northeast (+5.6%), followed closely by the West (+5.3%). In contrast, prices held relatively steady in the Midwest (+2.0%) and declined 0.6% in the South, year-over-year.
