Charts: Single-Family Permits Down Sharply in Q1 2023
Originally Published by: NAHB — June 16, 2023
SBCA appreciates your input; please email us if you have any comments or corrections to this article.
Over the first four months of 2023, the total number of single-family permits issued year-to-date (YTD) nationwide reached 268,205. On a year-over-year (YoY) basis, this is 29.0% below the April 2022 level of 377,713.
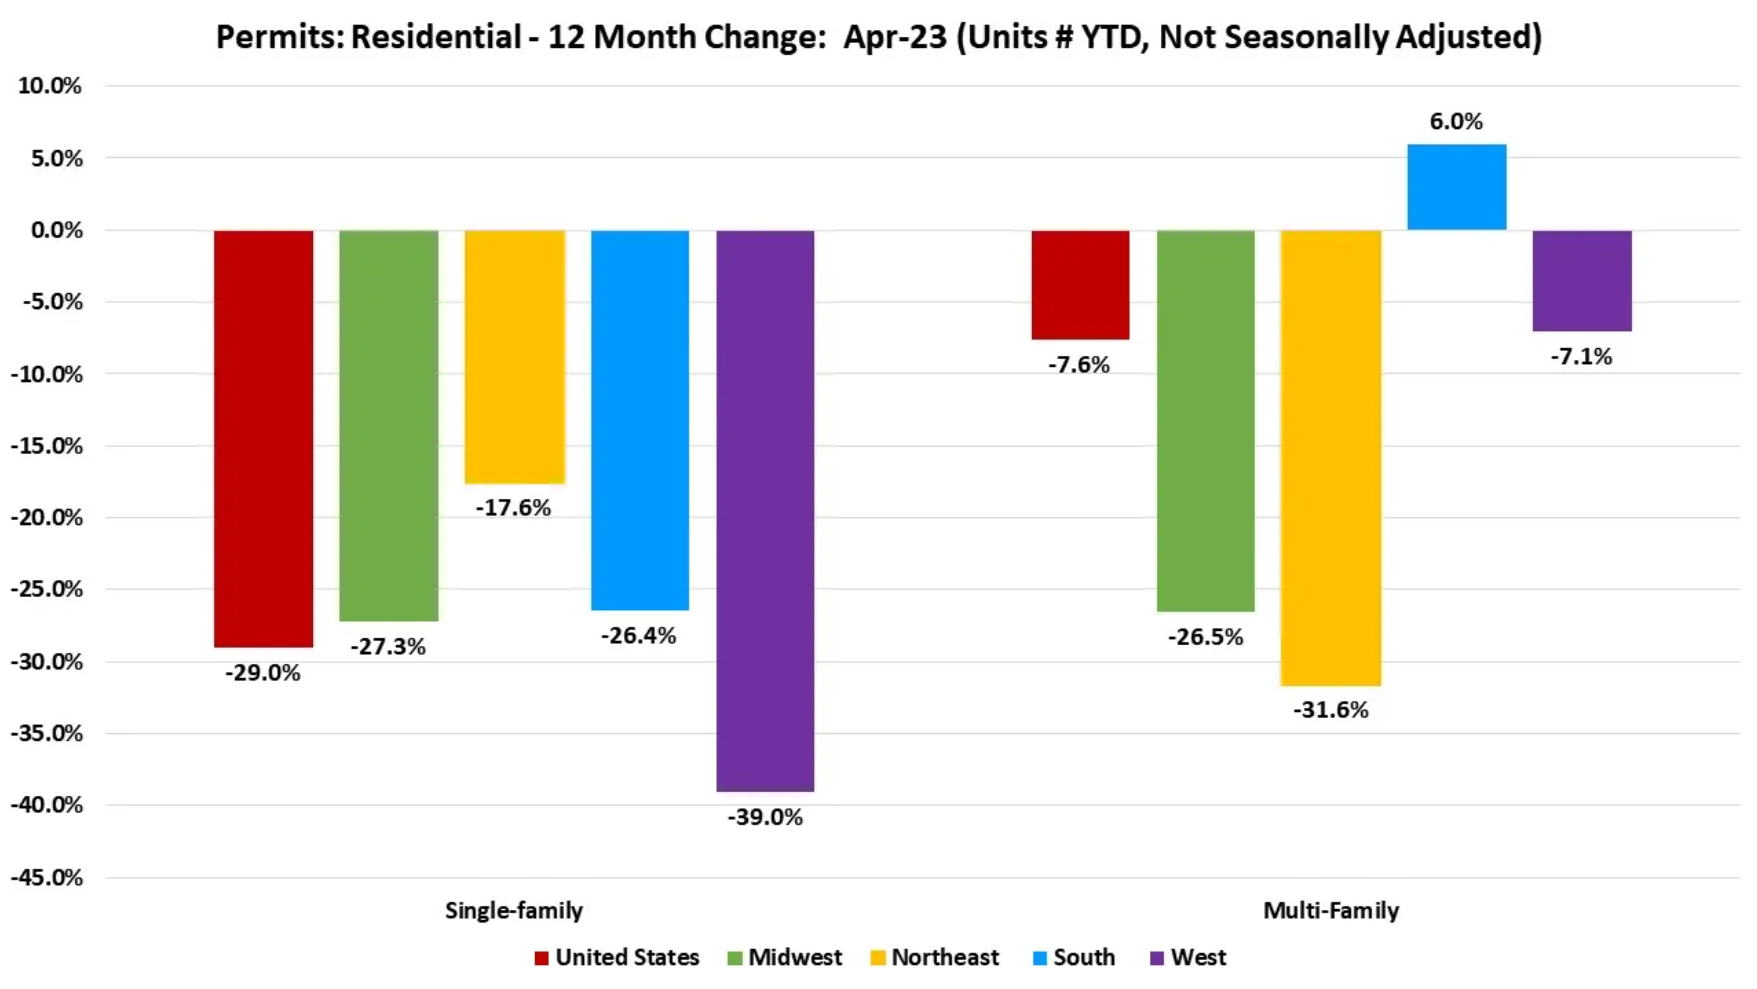
Year-to-date ending in April, single-family permits declined in all four regions. The Northeast posted the lowest decline of 17.6%, while the West region reported the steepest decline of 39.0%. The Midwest declined by 27.3% and the South declined by 26.4% in single-family permits during this time. For multifamily permits, the South is the only region to post an increase of 6.0% while the other three regions posted declines. Multifamily permits in the West were down 7.1%, Midwest down 26.5%, and down in the Northeast by 31.6%.
Between April 2022 YTD and April 2023 YTD, except for New Jersey, all the other states and the District of Columbia reported declines in single-family permits. New Jersey posted a modest 1.1% increase while the other states posted declines ranging from 4.5% in Hawaii to 59.7% in Montana. The ten states issuing the highest number of single-family permits combined accounted for 65.0% of the total single-family permits issued. Texas, the state with the highest number of single-family permits declined 31.6% in the past 12 months while the next two highest states, Florida and North Carolina declined by 27.4% and 19.3% respectively.

Year-to-date, ending in April, the total number of multifamily permits issued nationwide reached 196,589. This is 7.6% below the April 2022 level of 212,734.
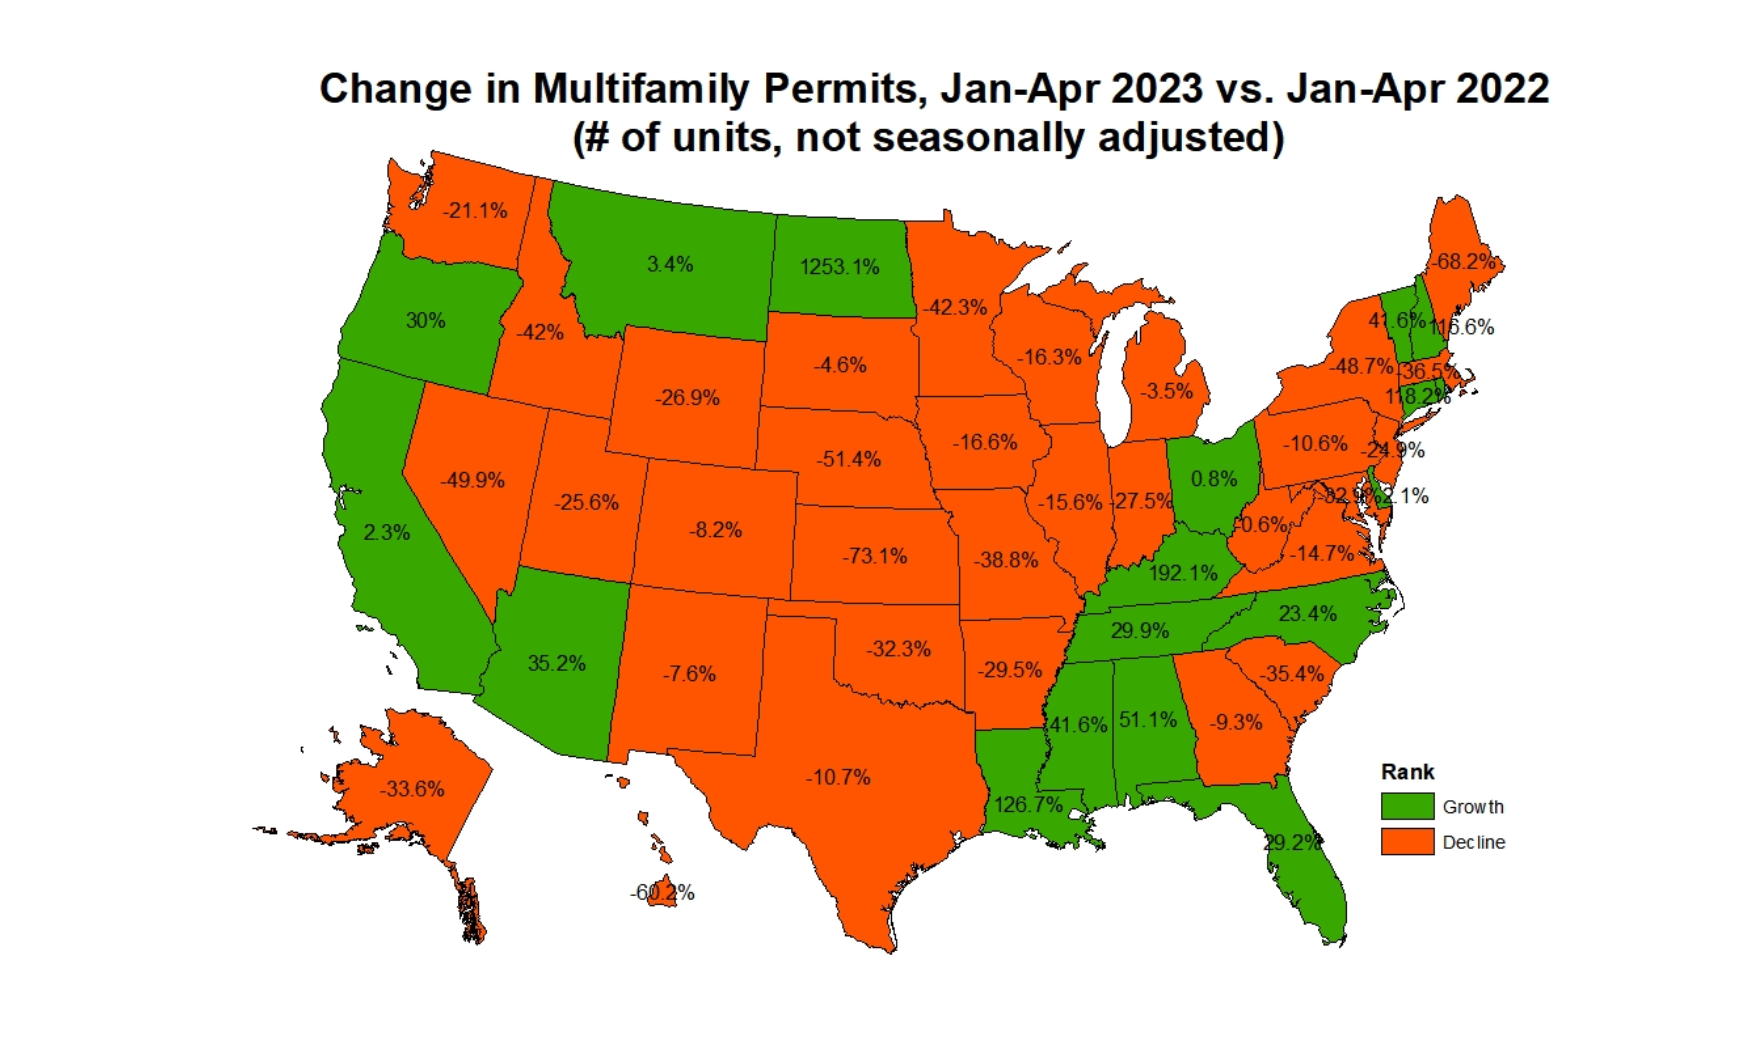
Between April 2022 YTD and April 2023 YTD, 18 states and the District of Columbia recorded growth, while 32 states recorded a decline in multifamily permits. North Dakota led the way with a sharp rise in multifamily permits from 32 to 433 while Kansas had the largest decline of 73.1% from 1,801 to 484. The ten states issuing the highest number of multifamily permits combined accounted for 65.4% of the multifamily permits issued. Texas, the state with the highest number of multifamily permits declined 10.7% in the past 12 months while the next two highest states, Florida and California increased by 29.2% and 2.3% respectively.
At the local level, below are the top ten metro areas that issued the highest number of single-family permits.
| Top 10 Largest SF Markets | Apr-23 (# of units YTD, NSA) | YTD % Change (compared to Apr-22) |
| Houston-The Woodlands-Sugar Land, TX | 15,391 | -22% |
| Dallas-Fort Worth-Arlington, TX | 12,738 | -29% |
| Atlanta-Sandy Springs-Roswell, GA | 7,385 | -27% |
| Phoenix-Mesa-Scottsdale, AZ | 6,597 | -49% |
| Charlotte-Concord-Gastonia, NC-SC | 6,185 | -20% |
| Orlando-Kissimmee-Sanford, FL | 5,344 | -20% |
| Austin-Round Rock, TX | 4,810 | -44% |
| Nashville-Davidson–Murfreesboro–Franklin, TN | 4,471 | -32% |
| Tampa-St. Petersburg-Clearwater, FL | 4,213 | -20% |
| Raleigh, NC | 4,084 | -25% |
For multifamily permits, below are the top ten local areas that issued the highest number of permits.
| Top 10 Largest MF Markets | Apr-23 (# of units YTD, NSA) | YTD % Change (compared to Apr-22) |
| New York-Newark-Jersey City, NY-NJ-PA | 10,155 | -42% |
| Dallas-Fort Worth-Arlington, TX | 7,887 | -19% |
| Houston-The Woodlands-Sugar Land, TX | 7,671 | 13% |
| Phoenix-Mesa-Scottsdale, AZ | 7,238 | 41% |
| Miami-Fort Lauderdale-West Palm Beach, FL | 6,669 | 87% |
| Austin-Round Rock, TX | 6,070 | -26% |
| Atlanta-Sandy Springs-Roswell, GA | 5,790 | 3% |
| Los Angeles-Long Beach-Anaheim, CA | 5,443 | -3% |
| Charlotte-Concord-Gastonia, NC-SC | 4,718 | 35% |
| Nashville-Davidson–Murfreesboro–Franklin, TN | 4,695 | 138% |