Multifamily Occupancy and Sentiment Continues to Strengthen
Originally Published by: Eye on Housing — November 19, 2021
SBCA appreciates your input; please email us if you have any comments or corrections to this article.
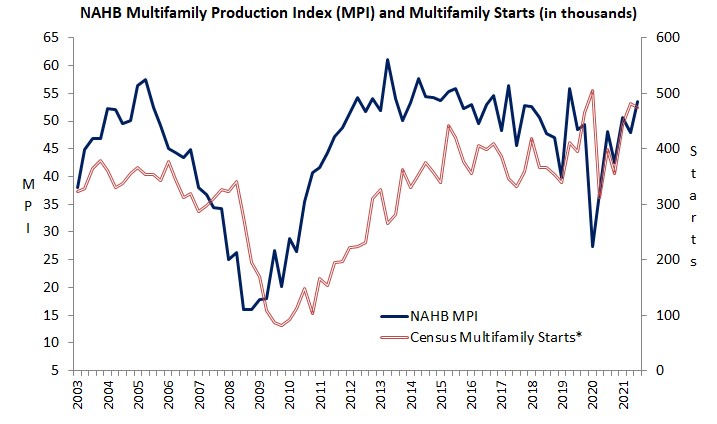
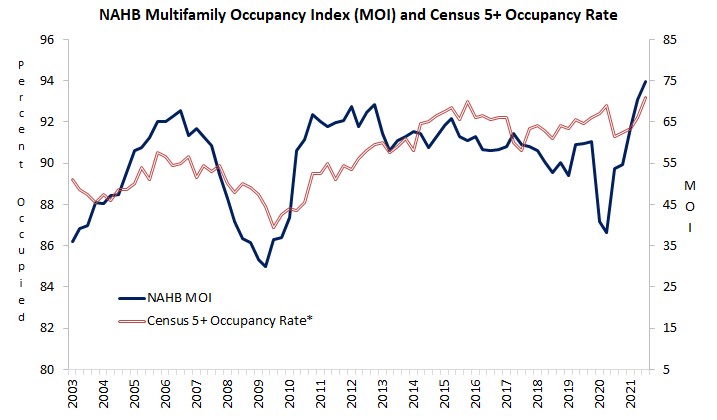
Sentiment on the production of new and occupancy in existing multifamily housing improved in the third quarter, according to the latest results from NAHB’s Multifamily Market Survey (MMS). The MMS produces two main indices. The Multifamily Production Index (MPI) increased five points from the previous quarter to 53, while the Multifamily Occupancy Index (MOI) also increased by five points, to 75. That’s the highest reading for the MOI since its inception in 2003.
The MPI is a weighted average of three component indices measuring developer sentiment about production in different segments of the multifamily market: low-rent apartments supported by low-income tax credits or other government subsidy programs; market-rate rental apartments built to be rented at an unsubsidized market-clearing price; and for-sale units (i.e., multifamily condominiums). Each component index lies on a scale on of 0 to 100, where a number above 50 indicates that more respondents report conditions are improving than report conditions are getting worse. All three MPI component indices increased in the third quarter. The component for low-rent apartments increased six points to 55, the component for market rate rental units rose nine points to 60; and the condo component posted a two-point gain to 47.

Similarly, the MOI measures the multifamily housing industry’s sentiment on occupancy in existing apartments. The MOI is also a weighted average of three components: for occupancy in class A, B, and C apartments. Again, each component index lies on a scale from 0 to 100, with a break-even point at 50, where numbers above 50 indicate rising occupancy. Two of the MOI’s components increased in the third quarter. The index for occupancy in class A apartments increased 8 points to 77, while the index for class B apartments increased 4 points to 75. Although the index for class C apartments declined by 3 points, to 70, all three component indices remain well above the break-even point of 50. Moreover, as noted above, the current MOI of 75 is the highest the overall occupancy index has been since its inception.

Strong demand and limited inventory of all types of housing are keeping occupancy strong in multifamily properties across the country. The same factors are supporting production of new multifamily properties, although developers continue to deal with very significant supply-side challenges, like finding enough labor, materials and land to build on.
The record-level MOI is consistent with the strong multifamily occupancy rates reported by the Census Bureau, which are now higher than they’ve been since the 1980s. And an MPI back above 50 is consistent with multifamily housing starts, which have been running at a 460,000-plus annualized rate through the first three quarters of 2021—which should make 2021 the strongest year for multifamily production since the tax policy-driven surge of the 1980s. As the economy continues to reopen, housing demand is rising in higher density markets, supporting both multifamily occupancy and production.
For complete results from the Multifamily Market Survey, including the history of each index and its components back to the survey’s inception in 2003, please visit NAHB’s MMS web page.
