Zonda Provides New Home Market Update for January 2026
Originally Published by: Zonda — February 24, 2026
SBCA appreciates your input; please email us if you have any comments or corrections to this article.
Zonda tracks 85% of the production new home market across the United States. Given the proprietary database, Zonda is uniquely positioned to capture trends and changes in the new home market. This report showcases the latest housing trends in the new home market for January 2026. 
A muted start to the year
Entering 2026, Zonda’s forecast was that the housing market would largely mirror the dynamics of 2025. Early indicators suggest this is playing out, though the variables remain a mix of promising shifts and persistent headwinds.
On the negative side, new home sales slid both month-over-month and year-over-year as we started the year. While the severe winter storms across the Midwest and South undoubtedly disrupted shopping behavior, a slowing labor market and wavering consumer confidence are also to blame. Mirroring this hesitation, new home search activity on NewHomeSource.com was down year-over-year, even as it managed a modest seasonal lift from December.
On the positive side, housing affordability is finally improving, albeit modestly. Interest rates trended down toward the 6% mark in January, and quick move-in inventory per community has improved for four consecutive months as builders successfully sell through standing stock.
“It remains difficult to make a uniform statement about the housing market today,” said Ali Wolf, chief economist for Zonda and NewHomeSource. “We are seeing a stark divergence where in some metros, traffic and sales are exceeding seasonal norms, while in others, qualified shoppers remain scarce and every transaction feels like a slog. The next few weeks will be important to watch to see how much traction the spring selling season truly has.”
New home sales fell year-over-year
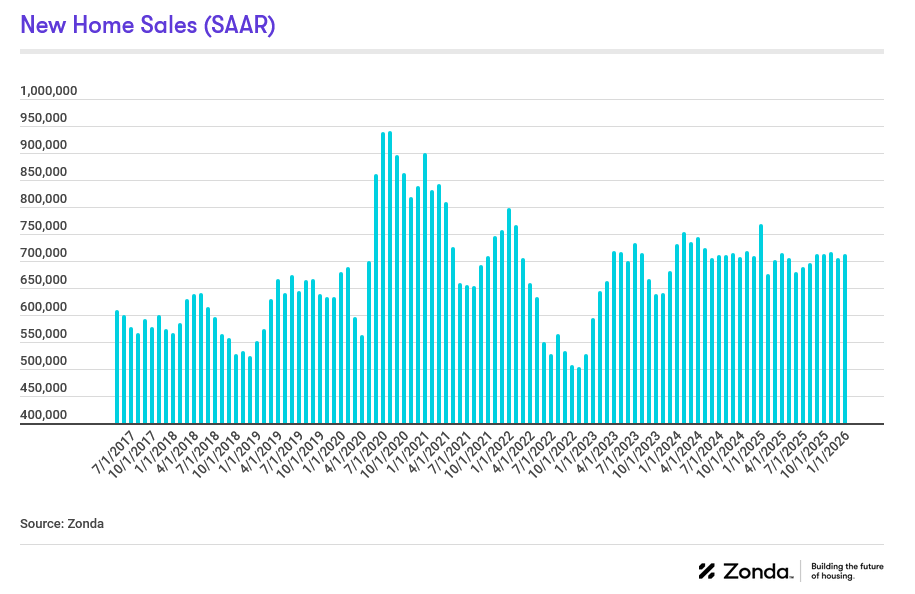
Zonda’s new home sales metric counts the number of new home contract sales each month and accounts for both cancellations and seasonality. This metric shows there were 713,104 new homes sold in January on a seasonally adjusted annualized rate. This was a gain of 1.0% from last month and a drop of 7.2% from a year ago. On a non-seasonally adjusted basis, 54,833 homes were sold, 6.5% lower than last year and 2.9% below the same month in 2019.
PSI signals a soft January
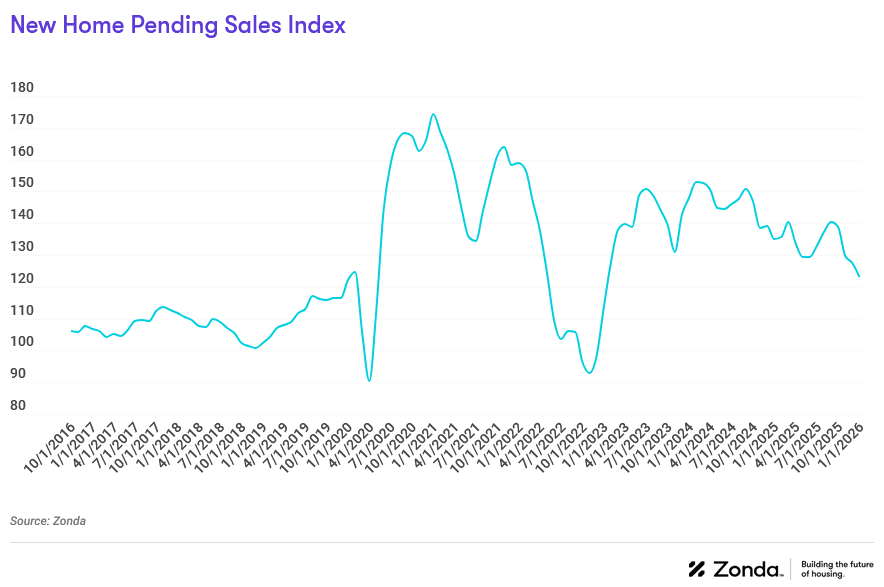
Zonda’s New Home Pending Sales Index (PSI) was created to help account for fluctuations in supply by combining both total sales volume with the average sales rate per month per community. The January PSI came in at 123.1, representing an 8.8% decline from the same month last year. The index is currently 29.3% below cycle highs. On a month-over-month basis, seasonally adjusted new home sales decreased 3.3%.
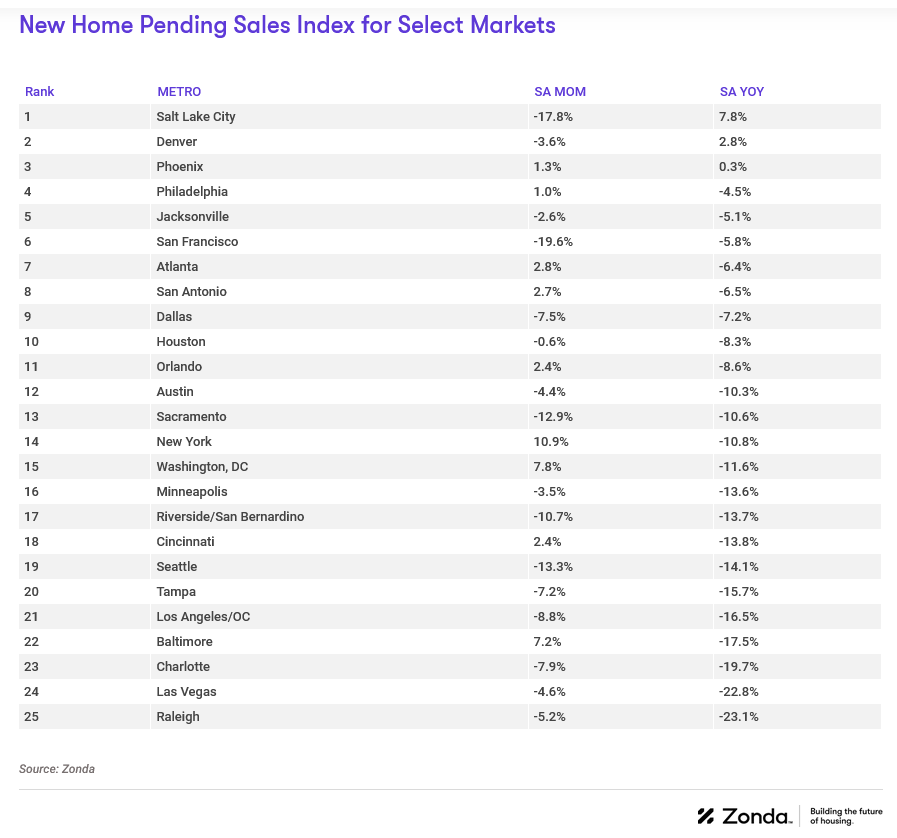
- The markets that posted the best numbers relative to last year were Salt Lake City (+7.8%), Denver (+2.8%), and Phoenix (+0.3%). Salt Lake City was up compared to last year despite falling 17.8% month-over-month.
- Inversely, the metros that performed the worst year-over-year were Raleigh (-23.1%), Las Vegas (-22.8%), and Charlotte (-19.7%).
- On a monthly basis, New York, Washington, DC, and Baltimore were the best performing markets. New York increased 10.9% relative to last month.
National ZMR ticks down slightly, still rated average
In order to add further context to sales, Zonda created the Zonda Market Ranking (ZMR). The ZMR accounts for both sales pace and volume, is seasonally adjusted, and is taken as a percentage relative to a baseline market average. Based on the percentage above or below baseline, markets are bucketed into performance groups ranging from significantly underperforming to significantly overperforming relative to historical activity.
The map below shows a snapshot of top production markets by region. Zonda also offers the ZMR for entry-level, move-up/move-down, and high-end markets. Subscribers of the National Outlook report can access all top markets and the tiered breakdown in Zonda’s portal. Non-subscribers can access the tiered maps for the select 10 markets by clicking here.
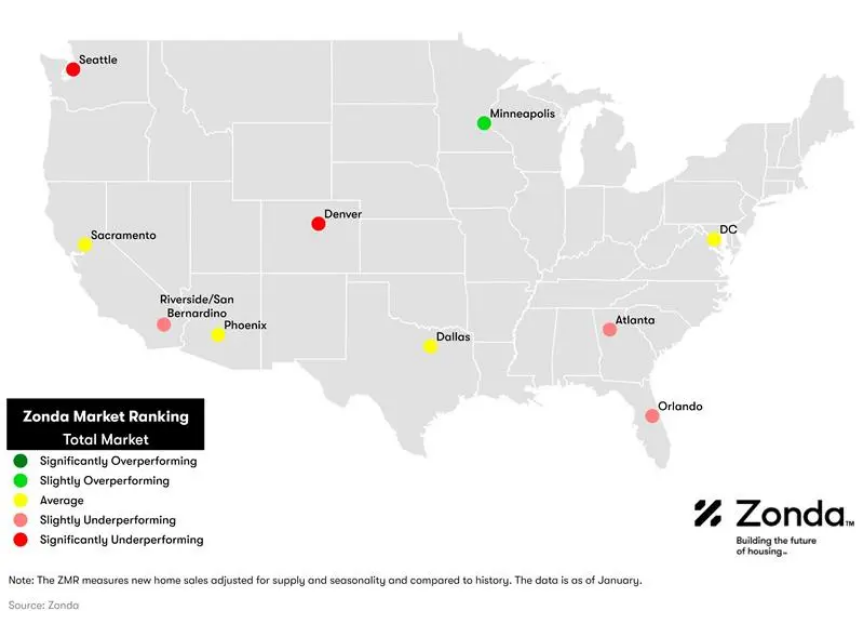
- The National ZMR index came in at 95.5 in January, which continued to indicate an average market.
- Zonda’s snapshot markets were split between 10% overperforming, 40% average, and 50% underperforming, reflecting a decline from last month. Among Zonda’s top 50 major markets, 26% were overperforming, 38% were average, and 36% were underperforming.
- Importantly, the ZMR does not account for what it takes to sell a home. For example, securing a sale might still feel difficult in a significantly overperforming market, but if the incentives offered result in a sale, we count the sale.
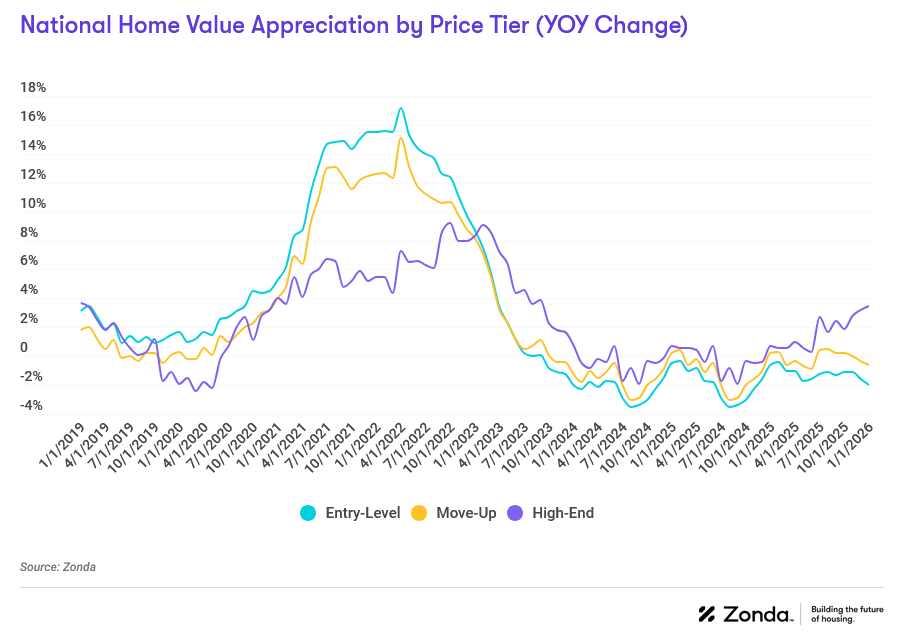
Price growth diverged between tiers
National home prices increased 3.5% year-over-year for high-end homes but fell elsewhere. Prices were down 2.0% for entry-level to $322,163 and 0.6% for move-up to $516,738. The rise in high-end home prices reflects new communities opening at higher price points, improvements in design quality, larger lots and home sizes, and/or better locations.
Supplementing our data with a survey Zonda conducts monthly, 20% of builders lowered prices in January month-over-month, 69% held prices flat, and 11% raised prices. In December, for comparison, 26% of builders lowered prices, 67% held prices flat, and 7% increased prices.
Incentives are still common in today’s housing market to help address the affordability constraints for buyers. In January, 60% of new home communities offered incentives on to-be-built homes and 78% on quick move-in supply. Note, these are only publicly available incentives so will underrepresent overall usage.
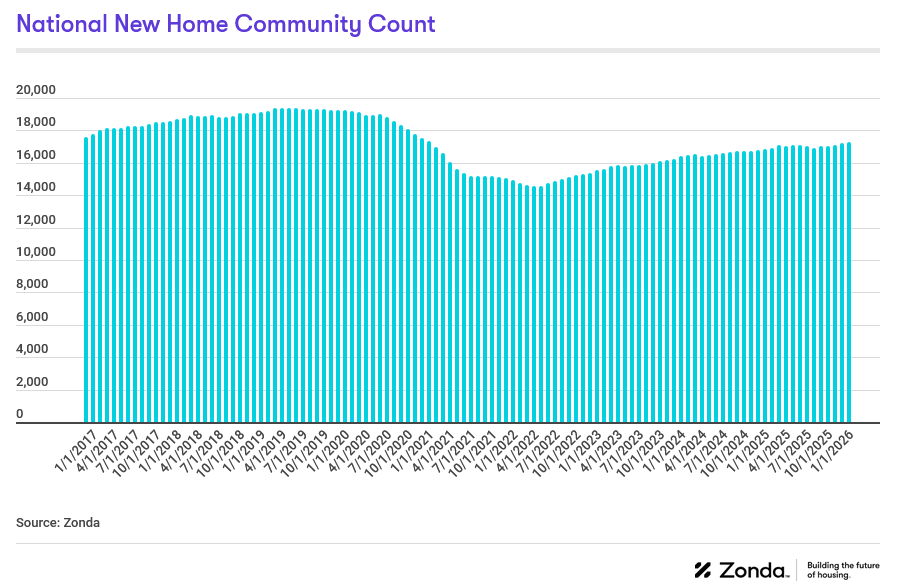
A notable improvement in QMIs
There are currently 17,268 actively selling communities tracked by Zonda, up 2.4% from last year. On a month-over-month basis, the national figure grew 0.6%. Total community count is 9.5% below the same month in 2019. Zonda defines a community as anywhere where five or more units are for sale.
- Charlotte (+9.1%), Riverside/San Bernardino (+7.7%), and Houston (+5.2%) grew community count the most year-over-year.
- Relative to last year, the biggest community count declines were in Minneapolis (-11.5%), Jacksonville (-10.6%), and Philadelphia (-10.4%).
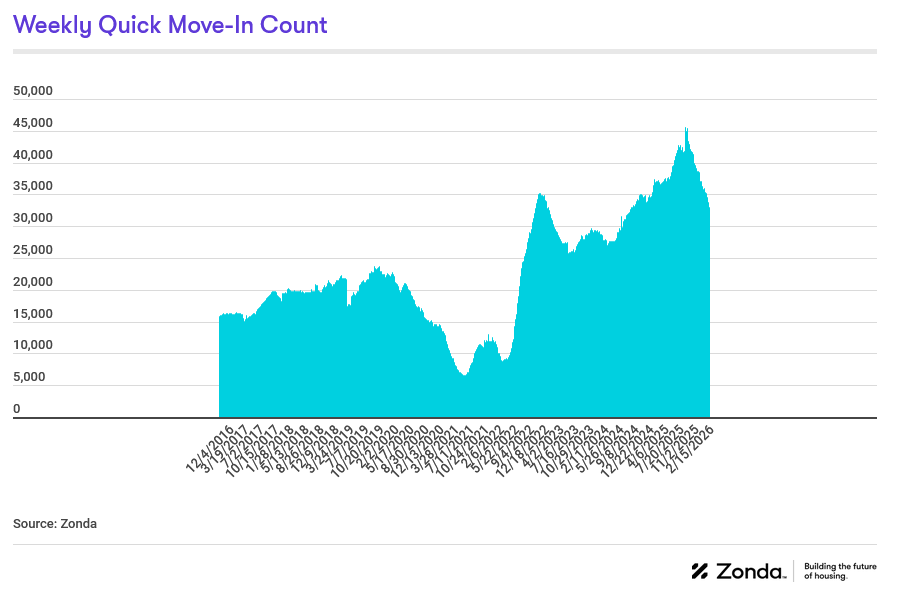
National quick move-ins (QMIs) totaled 33,034, down 1.1% compared to last year and 8.1% lower month-over-month. Total QMIs are 53.2% above 2019 levels. QMIs are homes that can likely be occupied within 90 days.
For many consumers, QMIs provide a great alternative to resale supply given they are brand new and (often) come with builder incentives. These homes aren’t flying off the shelf as they once did, though, so builders are still working through their backlog of inventory but are more cautious with new starts.
- On a metro basis, 56% of Zonda’s select markets increased QMI count year-over-year.
- The markets that grew the most year-over-year were Los Angeles/OC (+40.1%), Salt Lake City (+26.1%), and Washington, DC (+25.0%).
- Cincinnati, Phoenix, and Sacramento have seen the most growth in QMIs compared to the same time in 2019, up 267.5%, 184.4%, and 146.8%, respectively.
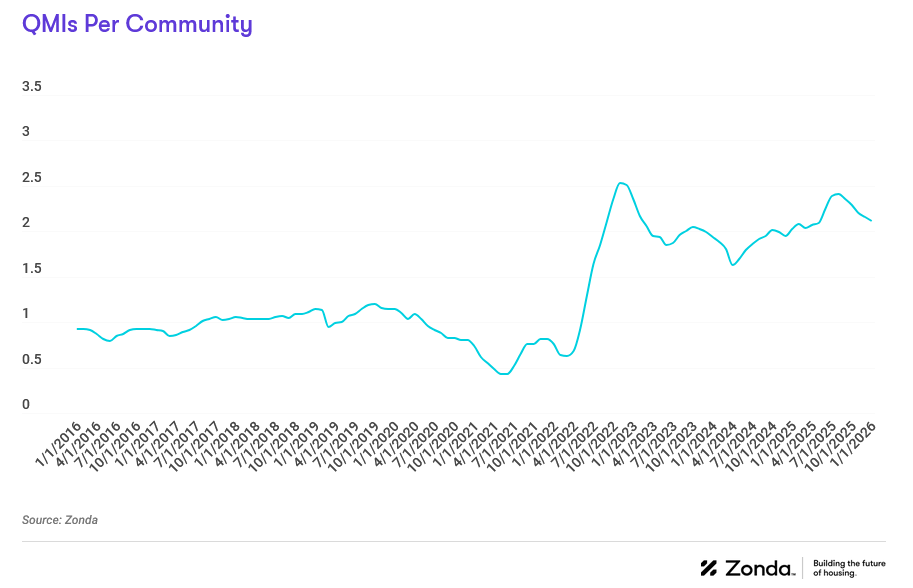
QMIs per community is a good way to track how new home supply looks in the context of actively selling projects. There were 2.1 QMIs per community nationally in January, up 7.9% from the 2.0 recorded this time last year but have trended down for four consecutive months.
Please note, the QMI per community data aligns with this report covering December trends. Our quick move-in data is weekly, and we release the latest available at the time of publishing this report. As such, recreating the visual below with the data above will yield slightly different results.