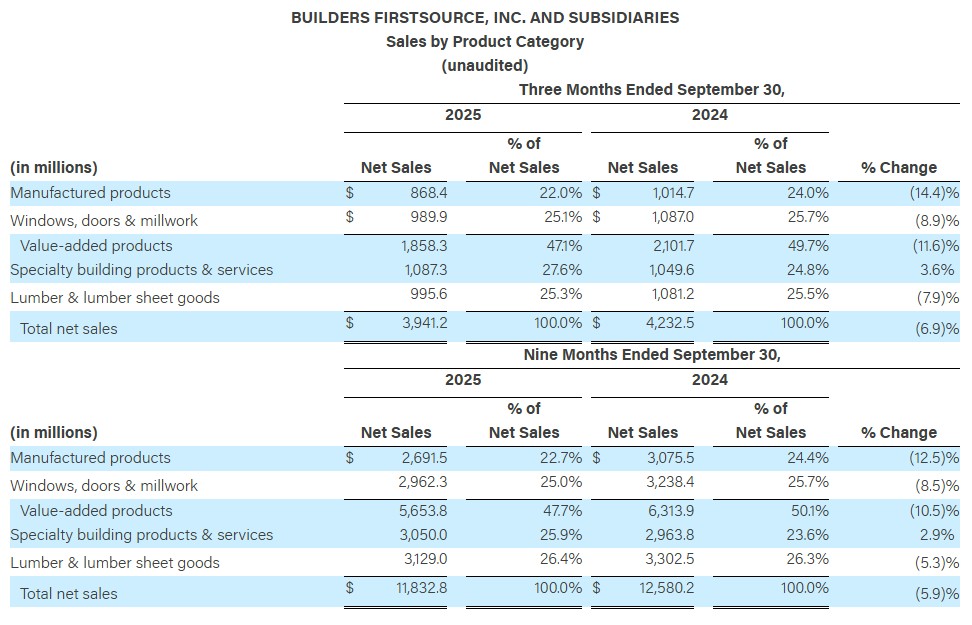
Builders FirstSource Reports Manufactured Products Net Sales Down 14.4% in Q3
Originally Published by: Builders FirstSource — October 30, 2025
SBCA appreciates your input; please email us if you have any comments or corrections to this article.
Third Quarter 2025 Highlights
All Year-Over-Year Comparisons Unless Otherwise Noted:
- Net sales were $3.9 billion, a 6.9% decrease, driven by lower core organic net sales and commodity deflation, partially offset by growth from acquisitions.
- Gross profit margin decreased 240 basis points to 30.4%, primarily driven by a below-normal starts environment.
- Net income was $122.4 million, or diluted EPS of $1.10 compared to diluted EPS of $2.44 in the prior year period. Net income as a percent of net sales decreased by 360 basis points to 3.1%.
- Adjusted EBITDA decreased 30.8% to $433.7 million, primarily driven by lower gross profit.
- Adjusted EBITDA margin declined by 380 basis points to 11.0%, attributable to lower gross margin and reduced operating leverage.
- Cash provided by operating activities was $547.7 million, a decrease of $182.2 million compared to the prior year period. The Company's free cash flow was $464.9 million, a decrease of 26.8%, compared to $634.7 million in the prior year period. The decrease was primarily driven by lower net income.
Peter Jackson, CEO of Builders FirstSource, commented: “Our third quarter results reflect the strength of our strategy and disciplined execution in a weak housing market. Over the past several years, we have transformed into a stronger organization powered by our leading network of value-added solutions, a relentless focus on operational excellence, and capital deployment. These pillars, combined with our scale and a team dedicated to exceptional customer service, reinforce our industry leadership position and our track record of success. By focusing on the factors within our control and leveraging our competitive advantages, we're competing effectively today and are poised to accelerate growth in a normal starts environment and deliver sustainable, long-term value for our shareholders.”
Pete Beckmann, CFO of Builders FirstSource, added, “We continue to execute our strategy in a down market, responding to near-term challenges by carefully managing costs while preserving our ability to invest for the future. Our financial agility, supported by a healthy balance sheet and strong free cash flow through the cycle, enables us to deploy capital prudently to fuel organic growth, pursue strategic M&A, and return capital to shareholders. These investments are bolstering our competitive position as we invest for the future.”
Third Quarter 2025 Financial Performance Highlights
All Year-Over-Year Comparisons Unless Otherwise Noted:
Net Sales
- Net sales were $3.9 billion, a 6.9% decrease, driven by a 10.6% decline in core organic net sales and commodity deflation of 1.1%, partially offset by growth from acquisitions of 4.8%.
- Core organic net sales declined 10.6%. Multi-Family declined 20.2%, Single Family declined 12.1%, and Repair and Remodel (“R&R”)/Other declined 1.2%. On a weighted basis, Single Family lowered net sales by 8.2%, Multi-Family by 2.2%, and R&R/Other by 0.2%.
Gross Profit
- Gross profit was $1.2 billion, a decrease of 13.5%. Gross profit margin percentage decreased 240 basis points to 30.4%, primarily driven by a below-normal starts environment.
Selling, General and Administrative Expenses
- SG&A was $970.7 million, an increase of $12.4 million, or 1.3%, primarily driven by additional expenses from operations acquired within the last twelve months and our ongoing enterprise resource planning system implementation, partially offset by lower variable compensation due to lower core organic sales and the absence of prior-year asset write-offs. As a percentage of net sales, total SG&A increased by 200 basis points to 24.6%, primarily attributable to reduced operating leverage.
Net Interest Expense
- Net interest expense increased $15.0 million to $69.3 million, primarily due to higher average debt balances.
Income Tax Expense
- Income tax expense was $37.1 million, compared to $89.0 million in the prior year period, primarily driven by a decrease in income before income tax. The effective tax rate in the third quarter decreased 50 basis points year-over-year to 23.3%, primarily related to decreased permanent and other differences.
Net Income
- Net income was $122.4 million, or $1.10 earnings per diluted share, compared to net income of $284.8 million, or $2.44 earnings per diluted share, in the same period a year ago. The 57.0% decrease in net income was primarily driven by lower gross profit and higher SG&A and net interest expense, partially offset by lower income tax expenses.
- Net income as a percentage of net sales was 3.1%, a decrease of 360 basis points from the prior year period, primarily due to lower gross profit margins and higher SG&A and net interest expense, partially offset by lower income tax expenses.
Adjusted Net Income
- Adjusted net income was $208.6 million, a decrease of 42.0%, primarily driven by lower gross profit and higher net interest expense, partially offset by lower income tax expenses.
Adjusted Earnings Per Diluted Share
-
Adjusted earnings per diluted share was $1.88, compared to $3.07 in the same period a year ago. The 38.8% decrease was primarily driven by lower adjusted net income, partially offset by share repurchases.
Adjusted EBITDA
- Adjusted EBITDA decreased 30.8% to $433.7 million, primarily driven by lower gross profit.
- Adjusted EBITDA margin declined by 380 basis points from the prior year period to 11.0%, primarily due to lower gross profit margins and reduced operating leverage.
Capital Structure, Leverage, and Liquidity Information
- For the three months ended September 30, 2025, cash provided by operating activities was $547.7 million, and cash used in investing activities was $102.5 million. The Company's free cash flow was $464.9 million, compared to $634.7 million in the prior year period, largely the result of lower net income.
- Liquidity as of September 30, 2025, was approximately $2.1 billion, consisting of $1.8 billion in net borrowing availability under the revolving credit facility and $0.3 billion of cash on hand.
- As of September 30, 2025, LTM Adjusted EBITDA was $1.8 billion and net debt was $4.2 billion, resulting in a net debt to LTM Adjusted EBITDA ratio of 2.3x, compared to 1.4x in the prior year period.
- Year to date, the Company has repurchased 3.4 million shares of its common stock at an average price of $118.65 per share for $403.6 million, inclusive of applicable fees and taxes.
- The Company has $500 million remaining under its share repurchase authorization.
- Since the inception of its buyback program in August 2021, the Company has repurchased 99.3 million shares of its common stock, or 48.1% of its total shares outstanding, at an average price of $80.90 per share for a total cost of $8.0 billion, inclusive of applicable fees and taxes.
Productivity Savings From Operational Excellence
- For the third quarter, the Company delivered approximately $11 million in productivity savings related to operational excellence and supply chain initiatives.
- Year to date, the Company has delivered approximately $33 million in productivity savings.
- The Company expects to deliver $45 million to $60 million in productivity savings in 2025.
2025 Full Year Total Company Outlook
For 2025, the Company expects to achieve the financial performance highlighted below. Projected Net Sales and Adjusted EBITDA include the expected impact of price, commodities, and margins for 2025.
- Net Sales to be in a range of $15.1 billion to $15.4 billion.
- Gross Profit margin to be in a range of 30.1% to 30.5%.
- Adjusted EBITDA to be in a range of $1.625 billion to $1.675 billion.
- Adjusted EBITDA margin to be in a range of 10.6% to 11.1%.
- Free cash flow in the range of $0.8 to $1.0 billion, assuming average commodity prices in the range of $370 to $390 per thousand board foot (mbf).
2025 Full Year Assumptions
The Company’s anticipated 2025 performance is based on several assumptions for the full year, including the following:
- Within the Company’s geographies, Single Family starts are projected to be down approximately 9%, Multi-Family starts down mid-teens, and R&R is projected to be flat.
- Acquisitions completed within the last twelve months are projected to add net sales growth of approximately 5%.
- Total capital expenditures in the range of $300 million to $350 million.
- Interest expense in the range of $270 million to $280 million.
- An effective tax rate of 20.0% to 22.0%.
- Depreciation and amortization expenses in the range of $550 million to $600 million.
- One fewer selling day is projected to decrease net sales by 0.4% in 2025 versus 2024.