Builders FirstSource Reports Q4 and Full-Year 2025 Results
Originally Published by: Builders FirstSource — February 17, 2026
SBCA appreciates your input; please email us if you have any comments or corrections to this article.
IRVING, Texas--(BUSINESS WIRE)-- Builders FirstSource, Inc. (NYSE: BLDR) today reported its results for the fourth quarter ended December 31, 2025.
Fourth Quarter 2025 Highlights
All Year-Over-Year Comparisons Unless Otherwise Noted:
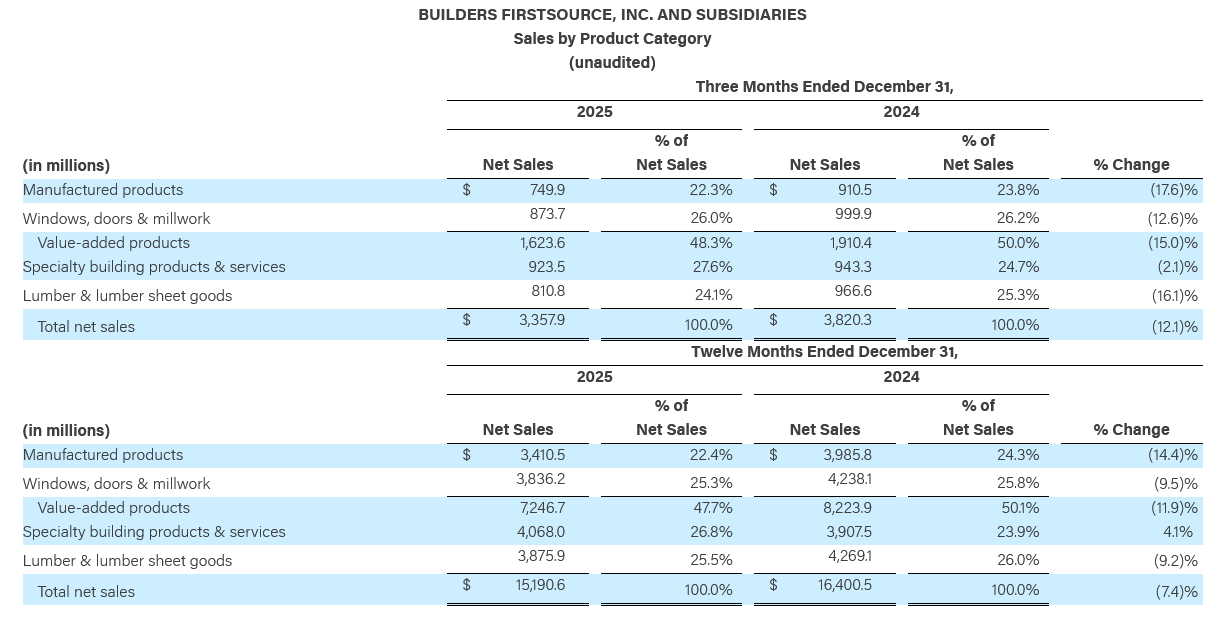
- Net sales were $3.4 billion, a 12.1% decrease, primarily due to a below-normal starts environment. The decline reflects lower core organic net sales and commodity deflation, partially offset by growth from acquisitions.
- Gross profit was $1.0 billion compared to gross profit of $1.2 billion in the prior year period. Gross profit margin decreased 250 basis points to 29.8%, primarily driven by a below-normal starts environment.
- Net income was $31.5 million, or diluted EPS of $0.28 compared to diluted EPS of $1.65 in the prior year period. Net income as a percent of net sales decreased by 410 basis points to 0.9%.
- Adjusted EBITDA decreased 44.3% to $274.9 million, primarily driven by lower gross profit.
- Adjusted EBITDA margin declined by 470 basis points to 8.2%, attributable to lower gross margin and reduced operating leverage.
- Cash provided by operating activities was $194.8 million, a decrease of $178.7 million compared to the prior year period. The Company's free cash flow was $109.1 million, a decrease of 60.7% compared to $277.3 million in the prior year period. The decrease was primarily driven by lower net income.
“Driven by focused execution and close customer partnerships, we successfully navigated 2025 despite ongoing housing affordability challenges, weak consumer confidence, and depressed commodity prices. We remain committed to reducing barriers to affordable housing and driving a more efficient, integrated supply chain. Our ability to perform effectively through each phase of the business cycle reflects the strength of our differentiated value-added solutions, industry-leading technology, and unique operating model,” commented Peter Jackson, CEO of Builders FirstSource.
Mr. Jackson continued, “Operating from a position of strength, we continued to invest in initiatives that enhance our capabilities, expand our footprint, and position us to outgrow the market as conditions improve. I am confident in our ability to manage through near-term uncertainty and build exceptional long-term value for our shareholders.”
Pete Beckmann, CFO of Builders FirstSource, added, “Our fourth quarter and full-year performance reflects disciplined execution in a weak housing market. We remain focused on managing costs, advancing key growth initiatives, and harnessing technology for long-term success. Supported by a fortress balance sheet and strong free cash flow through the cycle, we continue to manage capital with rigor and an intentional drive for organic growth while pursuing strategic M&A. We remain well situated to compound value as the housing market rebounds.”
Fourth Quarter 2025 Financial Performance Highlights
All Year-Over-Year Comparisons Unless Otherwise Noted:
Net Sales
- Net sales were $3.4 billion, a 12.1% decrease, primarily due to a below-normal starts environment. The decline reflects a 14.0% decline in core organic net sales as well as commodity deflation of 1.9%, partially offset by growth from acquisitions of 3.8%.
- Core organic net sales declined 14.0%. Multi-Family declined 20.4%, Single Family declined 15.4%, and Repair and Remodel (“R&R”)/Other declined 6.5%. On a weighted basis, Single Family lowered net sales by 10.3%, Multi-Family by 2.4%, and R&R/Other by 1.3%.
Gross Profit
- Gross profit was $1.0 billion, a decrease of 18.8%. Gross profit margin percentage decreased 250 basis points to 29.8%, primarily driven by a below-normal starts environment.
Selling, General and Administrative Expenses
- SG&A was $940.2 million, an increase of $10.2 million, or 1.1%, primarily driven by additional expenses from operations acquired within the last twelve months and our ongoing enterprise resource planning system implementation, partially offset by lower variable compensation due to lower core organic sales. As a percentage of net sales, total SG&A increased by 370 basis points to 28.0%, primarily attributable to reduced operating leverage.
Net Interest Expense
- Net interest expense increased $14.6 million to $67.8 million, primarily due to higher average debt balances.
Income Tax Benefit/Expense
- Income tax benefit was $37.5 million, compared to a $60.8 million expense in the prior year period, primarily due to lower income before income taxes and discrete tax adjustments.
Net Income
- Net income was $31.5 million, or $0.28 earnings per diluted share, compared to net income of $190.2 million, or $1.65 earnings per diluted share, in the same period a year ago. The 83.4% decrease in net income was primarily driven by lower gross profit and higher SG&A and net interest expense, partially offset by an income tax benefit.
- Net income as a percentage of net sales was 0.9%, a decrease of 410 basis points from the prior year period, primarily due to lower gross profit margins and higher SG&A and net interest expense, partially offset by an income tax benefit.
Adjusted Net Income
- Adjusted net income was $124.3 million, a decrease of 53.5%, primarily driven by lower gross profit and higher net interest expense, partially offset by an income tax benefit.
Adjusted Earnings Per Diluted Share
- Adjusted earnings per diluted share was $1.12, compared to $2.31 in the same period a year ago. The 51.5% decrease was primarily driven by lower adjusted net income, partially offset by share repurchases.
Adjusted EBITDA
- Adjusted EBITDA decreased 44.3% to $274.9 million, primarily driven by lower gross profit.
- Adjusted EBITDA margin declined by 470 basis points from the prior year period to 8.2%, primarily due to lower gross profit margins and reduced operating leverage.
Full-Year 2025 Financial Performance Highlights
All Year-Over-Year Comparisons Unless Otherwise Noted:
Net Sales
- Net sales were $15.2 billion, a 7.4% decrease, primarily due to a below-normal starts environment. The decline reflects a 10.3% decline in core organic net sales, commodity deflation of 1.3%, and one fewer selling day of 0.4%, partially offset by growth from acquisitions of 4.6%.
- Core organic net sales declined 10.3%. Multi-Family declined 23.5%, Single Family declined 9.0%, and Repair and Remodel (“R&R”)/Other declined 6.9%. On a weighted basis, Single Family lowered net sales by 6.1%, Multi-Family by 2.8%, and R&R/Other by 1.4%.
Gross Profit
- Gross profit was $4.6 billion, a decrease of 14.3%. Gross profit margin percentage decreased 240 basis points to 30.4%, primarily driven by a below-normal starts environment.
Selling, General and Administrative Expenses
- SG&A was $3.8 billion, an increase of $41.7 million, or 1.1%, primarily driven by additional expenses from operations acquired within the last twelve months and our ongoing enterprise resource planning system implementation, partially offset by lower variable compensation due to lower core organic sales and the absence of prior-year asset write-offs. As a percentage of net sales, total SG&A increased by 210 basis points to 25.2%, primarily attributable to reduced operating leverage.
Net Interest Expense
- Net interest expense increased $66.2 million to $273.9 million, primarily due to higher average debt balances.
Income Tax Expense
- Income tax expense was $77.2 million, compared to $309.6 million in the prior year period, primarily driven by a decrease in income before income tax. The full-year effective tax rate decreased 720 basis points year-over-year to 15.1%, primarily related to the benefit of income tax credits, impact of state income taxes and discrete tax adjustments, partially offset by permanent differences, relative to a decreased income before income taxes.
Net Income
- Net income was $435.2 million, or $3.89 earnings per diluted share, compared to net income of $1.1 billion, or $9.06 earnings per diluted share, in the same period a year ago. The 59.6% decrease in net income was primarily driven by lower gross profit and higher SG&A and net interest expense, partially offset by lower income tax expenses.
- Net income as a percentage of net sales was 2.9%, a decrease of 371 basis points from the prior year period, primarily due to lower gross profit margins and higher SG&A and net interest expense, partially offset by lower income tax expenses.
Adjusted Net Income
- Adjusted net income was $770.1 million, a decrease of 44.0%, primarily driven by lower gross profit and higher net interest expense, partially offset by lower income tax expenses.
Adjusted Earnings Per Diluted Share
- Adjusted earnings per diluted share was $6.89, compared to $11.56 in the same period a year ago. The 40.4% decrease was primarily driven by lower adjusted net income, partially offset by share repurchases.
Adjusted EBITDA
- Adjusted EBITDA decreased 32.0% to $1.6 billion, primarily driven by lower gross profit.
- Adjusted EBITDA margin declined by 380 basis points from the prior year period to 10.4%, primarily due to lower gross profit margins and reduced operating leverage.
Capital Structure, Leverage, and Liquidity Information
- For the three months ended December 31, 2025, cash provided by operating activities was $194.8 million, and cash used in investing activities was $305.2 million. The Company's free cash flow was $109.1 million, compared to $277.3 million in the prior year period, largely the result of lower net income.
- For the year ended December 31, 2025, cash provided by operating activities was $1.2 billion, and cash used in investing activities was $1.5 billion. The Company's free cash flow was $874.0 million, compared to $1.5 billion in the prior year period, largely the result of lower net income.
- Liquidity as of December 31, 2025, was approximately $1.7 billion, consisting of $1.5 billion in net borrowing availability under the revolving credit facility and $0.2 billion of cash on hand.
- As of December 31, 2025, LTM Adjusted EBITDA was $1.6 billion and net debt was $4.3 billion, resulting in a net debt to LTM Adjusted EBITDA ratio of 2.7x, compared to 1.5x in the prior year period.
- In 2025, the Company repurchased 3.4 million shares of its common stock at an average price of $118.65 per share for $0.4 billion, inclusive of applicable fees and taxes.
- The Company has $500 million remaining under its share repurchase authorization.
- Since the inception of its buyback program in August 2021, the Company repurchased 99.3 million shares of its common stock, or 48.1% of its total shares outstanding, at an average price of $80.90 per share for a total cost of $8.0 billion, inclusive of applicable fees and taxes.
Productivity Savings From Operational Excellence
- For the fourth quarter, the Company delivered approximately $15 million in productivity savings related to operational excellence and supply chain initiatives.
- In 2025, the Company delivered approximately $48 million in productivity savings.
- The Company expects to deliver $50 million to $70 million in productivity savings in 2026.
2026 Full Year Total Company Outlook
For 2026, the Company expects to achieve the financial performance highlighted below. Projected Net Sales and Adjusted EBITDA include the expected impact of price, commodities, and margins for 2026. We are not providing a quantitative reconciliation of our forward-looking guidance of adjusted EBITDA, adjusted EBITDA margin or free cash flow because we are unable to predict with reasonable certainty all the components required to provide such reconciliation without unreasonable efforts, which are uncertain and could have a material impact on GAAP reported results for the guidance period. See “Non-GAAP Financial Measures” for additional information.
- Net Sales to be in a range of $14.8 billion to $15.8 billion.
- Gross Profit margin to be in a range of 28.5% to 30%.
- Adjusted EBITDA to be in a range of $1.3 billion to $1.7 billion.
- Adjusted EBITDA margin to be in a range of 8.8% to 10.8%.
- Free cash flow of approximately $0.5 billion, assuming average commodity prices in the range of $365 to $385 per thousand board foot (mbf).
2026 Full Year Assumptions
The Company’s anticipated 2026 performance is based on several assumptions for the full year, including the following:
- Within the Company’s geographies, Single Family starts are projected to be flat, Multi-Family starts flat, and R&R is projected to be up 1%.
- Acquisitions completed within the last twelve months are projected to add net sales growth of approximately 1%.
- Total capital expenditures in the range of $250 million to $300 million.
- Interest expense in the range of $270 million to $280 million.
- An effective tax rate of 20% to 22%.
- Depreciation and amortization expenses in the range of $525 million to $575 million.
- No change in selling days versus 2025.