
Slower Population Growth Could Reshape Housing Demand
Originally Published by: LBM Executive —October 19, 2026
SBCA appreciates your input; please email us if you have any comments or corrections to this article.
Yikes. We’re well into Q3 2026 data now, and the more numbers we see, the more numbers we see that are moving in the wrong direction.
That’s not to say there’s no good news at all. September job growth was in the black even if it was a measly 29,000 jobs. Q2 GDP got a nice bump with the first revision: from 1.5% to 2.2% (annualized). AI investment may be propping up the economy, but so far it’s doing a decent job.
This is the first in a multi-part series that will explore the implications of declining U.S. population growth on residential construction supply.
But the bad numbers are stealing the show. The biggest and baddest is arguably the 30-year fixed mortgage rate. Six months ago we were playing footsies with loans under 6%. As of the week ending Oct. 8th, the national average was 7.40%.
Mortgage rates track yields on 10-year Treasury notes. Ten-year notes closed at 5.29% on Sept. 30th, their highest level since Mar. 2002. Why? Rising inflation caused by “a war with no clear end in sight,” says the Wall Street Journal.
With free passage disputed in both the Strait of Bab al-Mandab and the Strait of Hormuz (or as Canadians like to call it, the “Strait of Our Moose”) the signature accomplishment of the war in Iran has been to create “the largest supply disruption in the history of the global oil market,” says the International Energy Agency.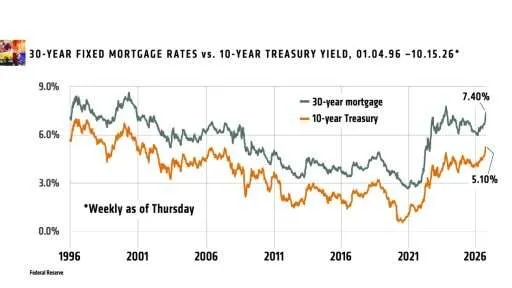
On Oct. 9th, the average price of a gallon of diesel fuel was $6.28, says AAA, up 71% YoY. When diesel goes through the roof, everything that gets transported to market (which is to say, everything) goes with it. Western nations are trying to push prices down by releasing their reserves, but those stockpiles won’t last much past the end of the year at current consumption rates.
The Fed’s target inflation rate is 2.0%. We were getting close last year—CPI fell to just 2.3% in Apr. 2025. Then tariffs pushed us up into the 3% range. Now energy prices have joined the party. Inflation rose to 4.2% in May, fell back to 3.4% in July and August, then jumped to 3.7% in September.
More price hikes are apparently on the way as we get into the heating season. The latest projection from the Federal Reserve Bank of Cleveland is that CPI will reach 4.77% in Q4.
Fear of inflation is why FOMC raised its benchmark rate by a quarter point in mid-September “for the first time in over three years,” notes Fox Business. It’s also one reason the bond market has started to worry about the U.S.—and demanded higher yields on Treasury notes to show its concern.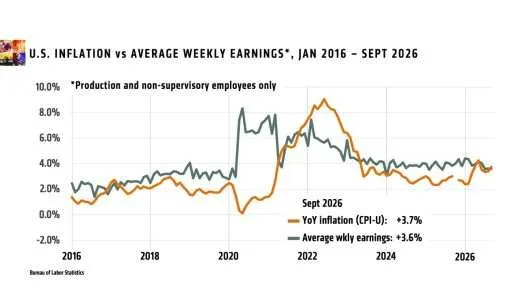
The other reason is our national debt. Gross federal debt blew past $40 trillion in August, and fully half of that amount was added in just the past ten years, reports Reuters: $8.4 trillion during the Biden years plus $11.6 trillion under two Trump administrations.
In 2021, we paid $350 billion in interest on our debt, or 10% of the total revenue collected by the federal government. This year interest payments will be around $1.36 trillion according to the Treasury Department. Unless something changes soon, the Committee for a Responsible Federal Budget says the interest we’ll pay on the national debt will be $2.1 trillion in 2036, or 25% of total federal revenue.
It’s no wonder bond investors are getting twitchy.
So are home builders. In August (latest data), single-family housing starts were 918,000 annualized, up 5.2% YoY but still 9.6% below 2024 levels. Multifamily was down 14.6% YoY at 357,000 starts.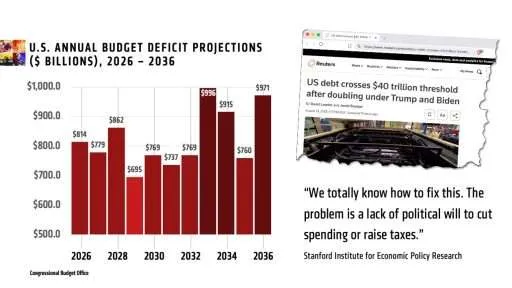
When single-family starts first began to slide in early 2025, most analysts thought we’d finish the year down 2% or 3%, then bounce back in 2026. Instead, we ended 2025 down 7.3% YoY.
Now the consensus is that single-family will fall another 4% or 5% in 2026, tread water in 2027, then start to climb out in 2028. Those projections were made before mortgage rates spiked last month, so they may well be in for revisions.
Everyone knows affordability is the primary problem, and existing home prices are still rising. At $417,800 in September, the median price of a single-family home was up 1.3% YoY. It should be no surprise that sales were an anemic 3.99 million (annualized).
But new home sales were no less anemic. In a typical year, builders sell 750,000 to 900,000 single-family units. August sales came in at 684,000.
While new home prices have drifted lower for most of 2026, the August median, $393,700, is still out of reach for over half of Americans. In August, builders were sitting on 8.5 months of unsold inventory; six months is normal.
So it’s also no surprise that builder sentiment is down. NAHB-Wells Fargo’s HMI fell to 32 in September, a three-year low point. Expectations for buyer traffic and sales in the next six months are at their lowest levels since 2011.
Everyone also knows more homes would ease the affordability crunch. But there’s a new wrinkle in the labor shortage that is dragging down production.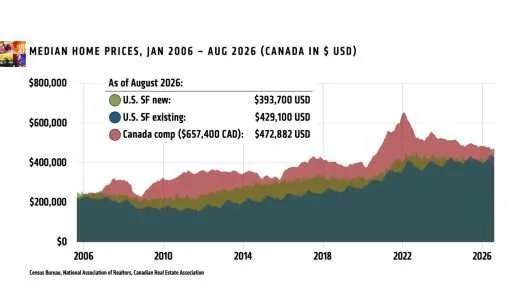
Builders are telling John Burns Research & Consulting (JBREC) that ICE raids on jobsites are “thinning framing, drywall, and concrete crews.” Immigrant trades who haven’t been snatched up are responding just as you would, too: They’re refusing to show up on jobsites for fear of exposing themselves.
A recent survey by KFF and the New York Times found that 40% of undocumented immigrants and 13% of legal migrants have skipped work for fear of ICE. According to NAHB, one-third of U.S. construction workers are immigrants.
All this might make you think of the words of the immortal Roy Clark: “If it weren’t for bad luck, I’d have no luck at all.”
Except there was no luck involved. Every issue that is hobbling the economy right now was the result of deliberate decisions. Not to say they were all bad decisions. Sometimes you need to take a step back in order to take two forward. But if the goal was to make the U.S. more prosperous, it isn’t happening yet.
So the question facing suppliers is how to navigate a moderately crappy housing market with few prospects of becoming less crappy in the near term. No one thinks housing will hit the wall like 2008, and most suppliers have plenty of experience weathering downturns.
But this particular downturn includes a curveball no one in the business has seen before.
The modern era of housing began shortly after World War II. Sometimes we built too many homes, sometimes not enough, and regular (occasionally severe) boom-bust cycles were the result. But the anchor that kept the pendulum swinging was a steadily-growing population. From the mid-1950s to the mid-2010s, the American population grew by an average of slightly north of 2.6 million people each year.
Every industry benefited, including housing. Gross domestic product is the sum of the economic output of everyone who works. The more people you add, the greater the output.
Steady growth drove prosperity in the housing industry by creating a steady feed of new households: just over 1.3 million per year on average between 1965 and 2015. Every household requires a house. Throw in second homes and replacements, and that translated into demand for roughly 1.5 million new housing units each year.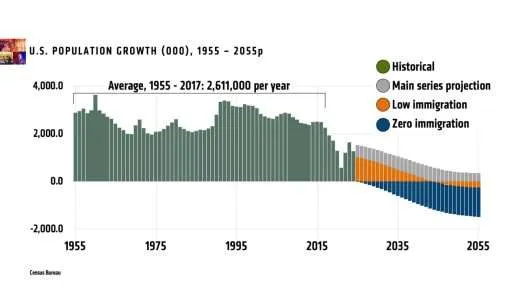
That era is over. Population growth has slowed dramatically since the mid-2010s, and the U.S. population will begin to shrink sometime during this century. Might be 60 years from now, might be 20 years—or it may be happening right now.
Part of the reason is that the post-World War II baby boom generation is aging out of the housing market. The oldest Boomers turned 80 last year. But the wild card is immigration.
Birth rates surged following World War II, then began to decline in the 1960s. The birth rate has been below replacement levels since the early 1970s. We’ve continued to grow only because the U.S. has been the most popular destination on the planet for immigrants.
Now we’ve shut that door. According to Gallup, 62% of Americans disapprove of what the Trump administration is doing to reduce immigration. But it is reasonable to argue that we needed to do something. In a typical year, the U.S. admits 1.2 to 1.4 million new legal residents, says the Migration Policy Institute. In 2024, 2.8 million migrants entered the country.
By all accounts, the government crackdown has been effective. The Census Bureau estimates that total immigration will fall to just 320,000 in 2026. But that means population growth will be minimal, which in turn means new household formation will fall—and along with it, demand for new homes.
JBREC projects new home demand to average 1.0 million units per year from 2026 to 2035. That’s a 33% decline from the 1.5-million-unit average of the 1990s and 2000s.
The Harvard Joint Center for Housing Studies believes even those numbers are overoptimistic. If immigration remains at or near current levels—and so far, there is no indication that it won’t—the Joint Center projects annual demand to average just 686,500 from now through 2036.
There are a lot of variables in demographic projections; some of the underlying numbers can be hard to pin down. But it is a safe bet that the days when we needed 1.5 million housing starts every year to keep pace with demand are over.
That creates a situation we’ve never seen before. Once demand for new housing falls beyond a certain level, we won’t need as many home builders as we have right now—and we may not need as many lumberyards, either.
If there’s good news, it’s that demographic trends are, above all else, slow. The “new era,” if you want to call it that, will take at least a decade to mature. LBM suppliers have the time they need to evaluate and choose new strategies, then implement them.
Those who currently rely on residential new construction will either need to find a competitive advantage others can’t easily duplicate, or develop alternative markets (or both). Those who already focus on alternative markets will need to prepare for stiffer (but not necessarily smarter) competition.
The strategies don’t have to be perfect. They can be refined as you go. Everyone is in the same situation, and it’s a little like the explorers who encountered a tiger in the jungle: I don’t have to outrun the tiger—I just have to outrun you.
Part two of this series will explore the implications of declining household growth on the single-family production market.