Zonda Provides Latest New Home Market Update
Originally Published by: Zonda — January 22, 2026
SBCA appreciates your input; please email us if you have any comments or corrections to this article.
New home sales remained effectively flat relative to last year
The 2025 housing market was tough for builders as buyers remained paralyzed by poor affordability and  low confidence. With affordability improving only marginally, sales struggled to gain traction throughout the year despite supply growth. This forced builders to lean heavily on aggressive price cuts and financing incentives to maintain sales momentum, move standing inventory, and sell future homesites.
Heading into 2026, the outlook is mixed. While the labor market is cooling, mortgage rates are finally showing signs of improvement. Builders have also remained disciplined with supply, which has helped prevent the type of surplus seen in past cycles. If lower rates succeed in drawing entry-level and high-equity buyers back into the fold, the market may finally find its floor. That said, the key wildcard remains employer hiring and firing plans.
“As we look for an early read on the 2026 spring selling season, core metrics such as home prices, listings, quick move-in supply, affordability, and sales will remain top of mind,” said Ali Wolf, Chief Economist for Zonda and NewHomeSource. “Beyond those, though, we believe consumer confidence, the directional trend of mortgage rates, and federal policy changes will play an outsized role in shaping the housing market this year.”
New home sales largely flat YOY
Zonda’s new home sales metric counts the number of new home contract sales each month and accounts for both cancellations and seasonality. This metric shows there were 705,682 new homes sold in December on a seasonally adjusted annualized rate. This was a decline of 1.5% from last month and a drop of 0.4% from a year ago. On a non-seasonally adjusted basis, 54,021 homes were sold, 0.4% higher than last year and 11.8% above the same month in 2019. 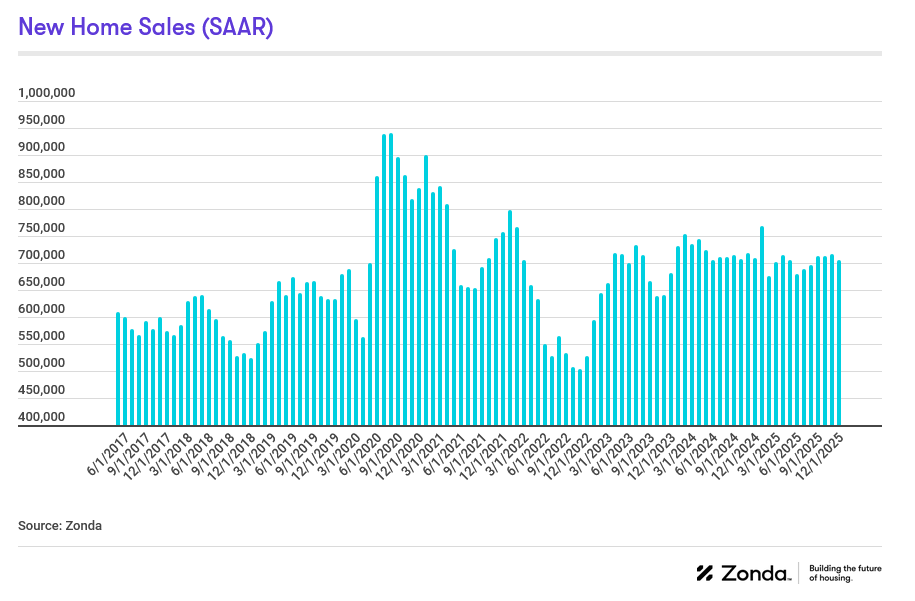
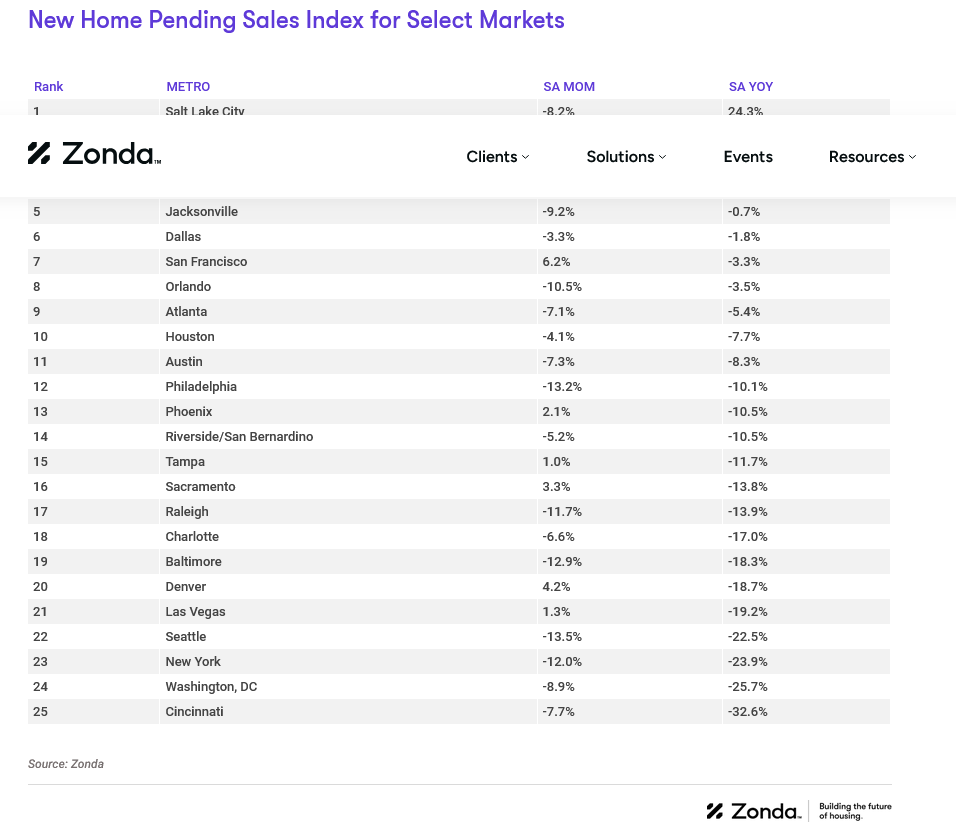
PSI down 6.5% YOY
Zonda’s New Home Pending Sales Index (PSI) was created to help account for fluctuations in supply by combining both total sales volume with the average sales rate per month per community. The December PSI came in at 130.1, representing a 6.5% decline from the same month last year. The index is currently 25.3% below cycle highs. On a month-over-month basis, seasonally adjusted new home sales increased 0.2%. 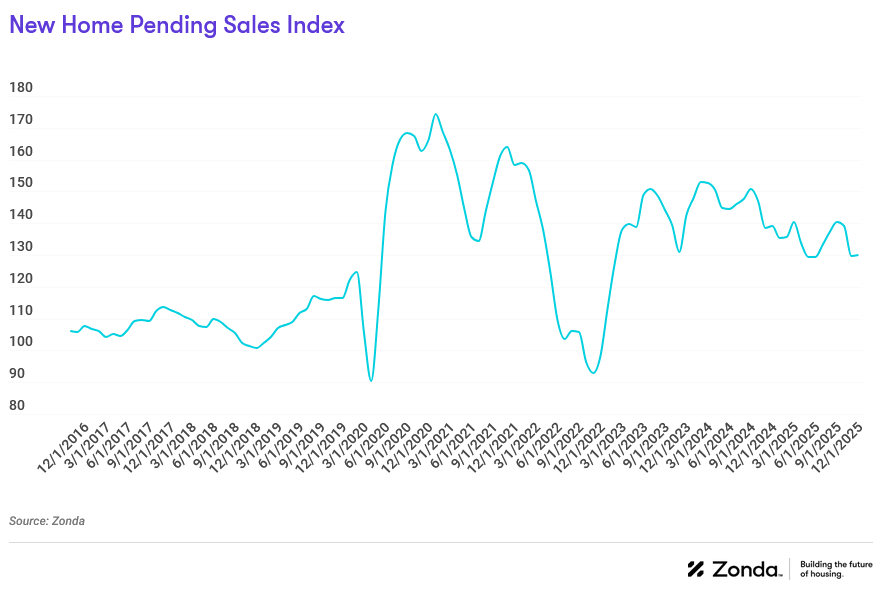
- The markets that posted the best numbers relative to last year were Salt Lake City (+24.3%), Minneapolis (+3.4%), and San Antonio (+3.2%). Salt Lake City was up compared to last year but fell 8.2% month-over-month.
- Inversely, the metros that performed the worst year-over-year were Cincinnati (-32.6%), Washington, DC (-25.7%), and New York (-23.9%).
- On a monthly basis, San Francisco, Denver, and Sacramento were the best performing markets. San Francisco increased 6.2% relative to last month.
National ZMR ranked average in every month of 2025
In order to add further context to sales, Zonda created the Zonda Market Ranking (ZMR). The ZMR accounts for both sales pace and volume, is seasonally adjusted, and is taken as a percentage relative to a baseline market average. Based on the percentage above or below baseline, markets are bucketed into performance groups ranging from significantly underperforming to significantly overperforming relative to historical activity.
The map below shows a snapshot of top production markets by region. Zonda also offers the ZMR for entry-level, move-up/move-down, and high-end markets. Subscribers of the National Outlook report can access all top markets and the tiered breakdown in Zonda’s portal. Non-subscribers can access the tiered maps for the select 10 markets by clicking below. 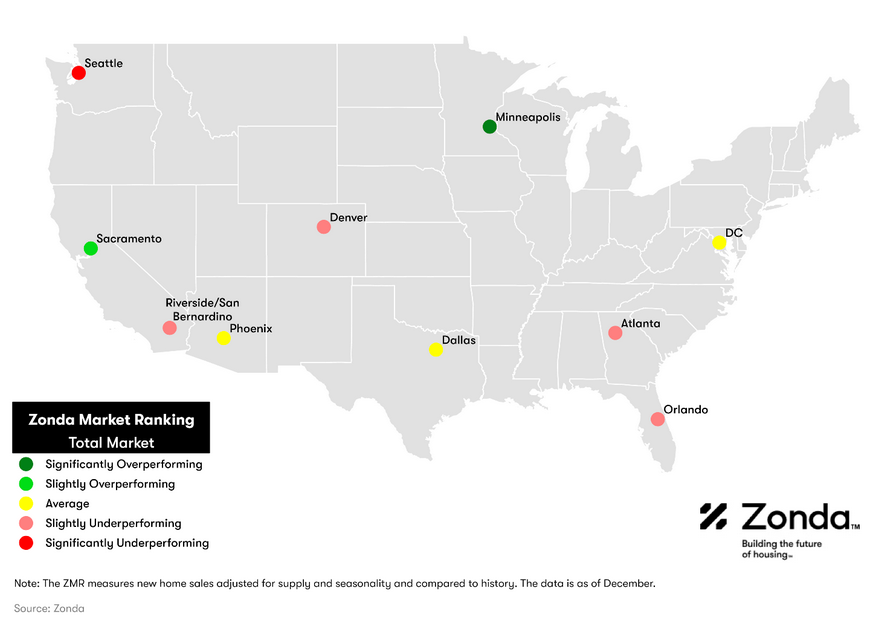
- The National ZMR index came in at 101.5 in December, which continued to indicate an average market. The national ZMR was average throughout all of 2025 after being rated slightly overperforming for all of 2024.
- Zonda’s snapshot markets were split between 20% overperforming, 30% average, and 50% underperforming, reflecting a modest decline from last month. Among Zonda’s top 50 major markets, 32% were overperforming, 34% were average, and 34% were underperforming.
- Importantly, the ZMR does not account for what it takes to sell a home. For example, securing a sale might still feel difficult in a significantly overperforming market, but if the incentives offered result in a sale, we count the sale.
Entry-level prices were down
National home prices fell 1.6% for entry-level to $322,727 and 0.2% for move-up to $516,004 but rose 3.5% for high-end homes to $935,646. The rise in high-end home prices reflects new communities opening at higher price points, improvements in design quality, larger lots and home sizes, and/or better locations.
Supplementing our data with a survey Zonda conducts monthly, 26% of builders lowered prices in December month-over-month, 67% held prices flat, and 7% raised prices. In November, for comparison, 37% of builders lowered prices, 61% held prices flat, and 2% increased prices. 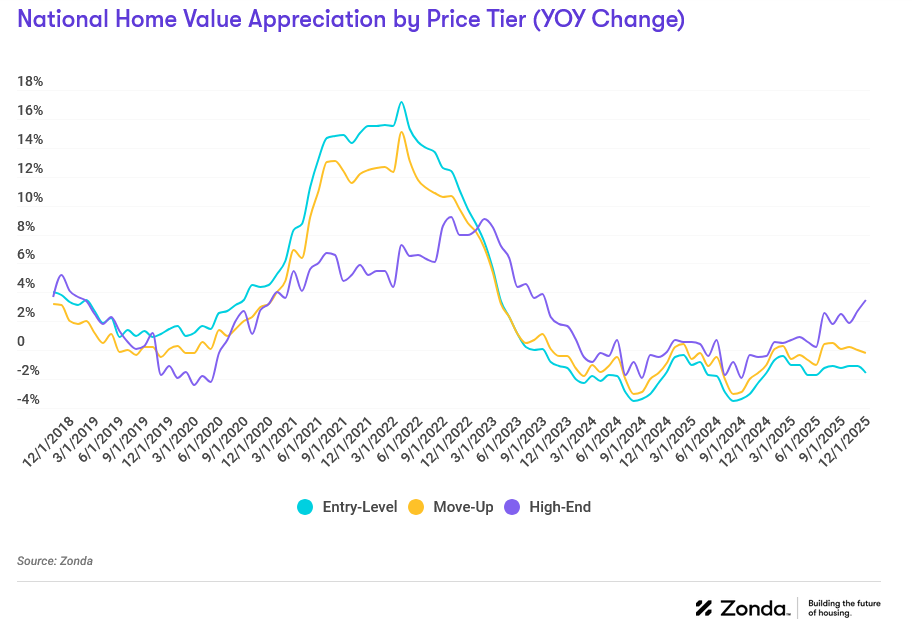
Incentives are still common in today’s housing market to help address the affordability constraints for buyers. In December, 60% of new home communities offered incentives on to-be-built homes and 78% on quick move-in supply. Note, these are only publicly available incentives, so they will underrepresent overall usage.
Community counts were rangebound in 2025
There are currently 17,196 actively selling communities tracked by Zonda, up 2.5% from last year. On a month-over-month basis, the national figure grew 0.9%. The national community count remains below the same month in 2019. Zonda defines a community as anywhere where five or more units are for sale. 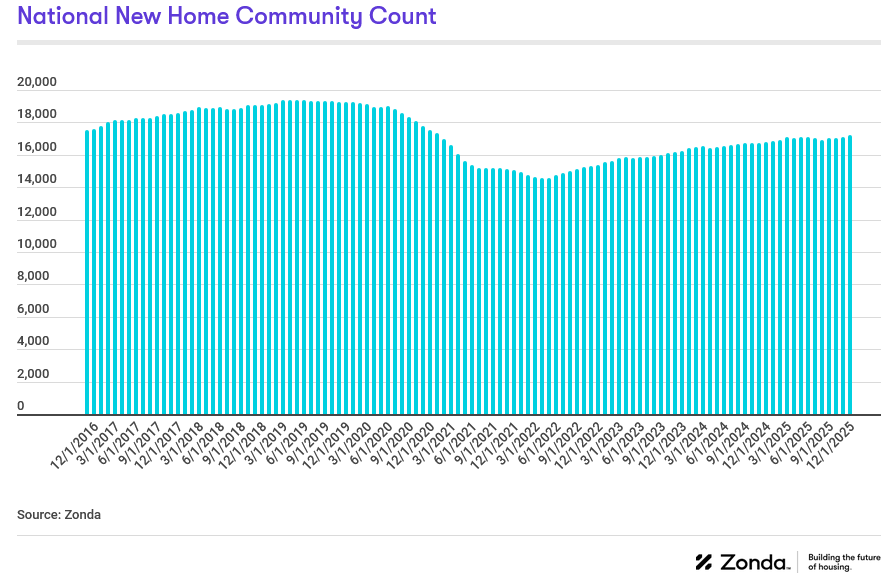
- Charlotte (+12.7%), Riverside/San Bernardino (+6.8%), and Houston (+5.0%) grew community count the most year-over-year.
- Relative to last year, the biggest community count declines were in Philadelphia (-16.5%), New York (-11.4%), and Minneapolis (-11.2%).
National quick move-ins (QMIs) totaled 34,840, up 4.4% compared to last year but 9.4% lower month-over-month. Total QMIs are 61.8% above 2019 levels. QMIs are homes that can likely be occupied within 90 days.
For many consumers, QMIs provide a great alternative to resale supply given they are brand new and (often) come with builder incentives. These homes aren’t flying off the shelf as they once did, though, so builders are still working through their backlog of inventory but are more cautious with new starts. 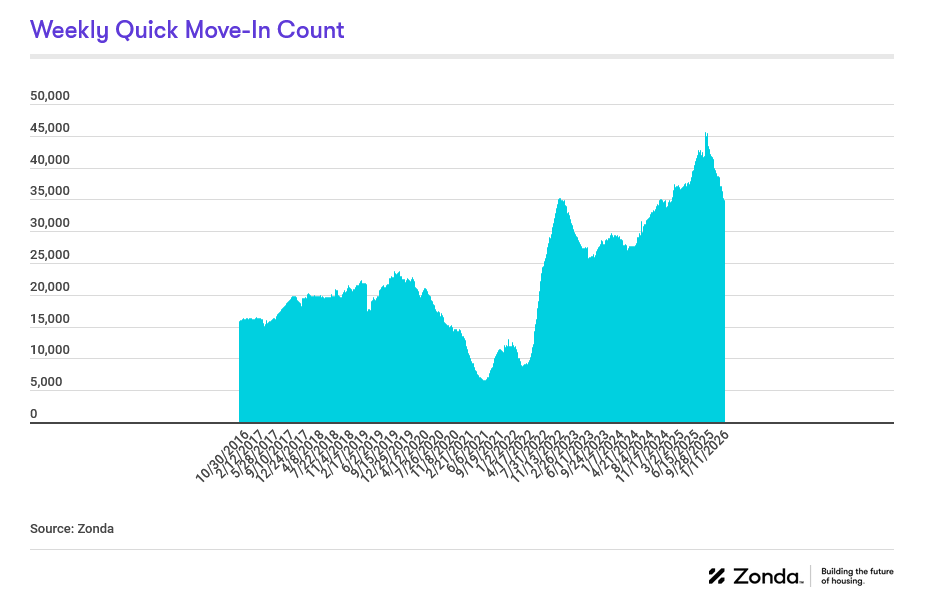
- On a metro basis, 76% of Zonda’s select markets increased QMI count year-over-year.
- The markets that grew the most year-over-year were Baltimore (+82.5%), Washington, DC (+54.8%), and Seattle (+51.0%).
- Las Vegas, Riverside/San Bernardino, and Jacksonville have seen the most growth in QMIs compared to the same time in 2019, up 233.7%, 191.0%, and 178.1%, respectively.
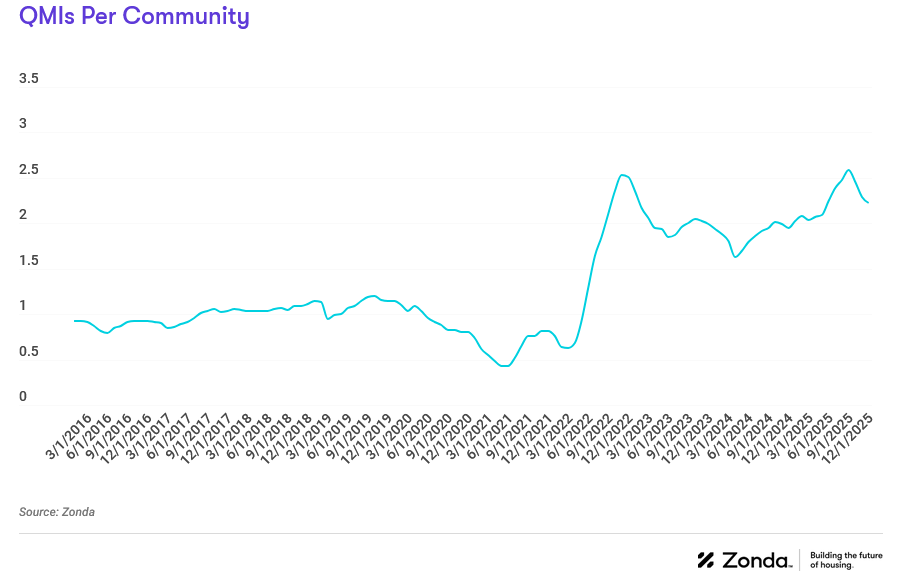
QMIs per community is a good way to track how new home supply looks in the context of actively selling projects. There were 2.2 QMIs per community nationally in December, up 14.9% from the 1.9 recorded this time last year but have trended down for three consecutive months.
Please note, the QMI per community data aligns with this report covering December trends. Our quick move-in data is weekly, and we release the latest available at the time of publishing this report. As such, recreating the visual below with the data above will yield slightly different results.