
Zonda Provides New Home Market Update for July 2026
Originally Published by: Zonda — August 20, 2026
SBCA appreciates your input; please email us if you have any comments or corrections to this article.
Zonda tracks 85% of the production new home market across the United States. Given the proprietary database, Zonda is uniquely positioned to capture trends and changes in the new home market. This report showcases the latest housing trends in the new home market for July 2026.
The new home market is treading water
The July housing market was challenging for new home builders. Sales declined 1.4% month-over-month and 1.1% year-over-year despite builders’ ongoing efforts to stimulate demand through incentives and pricing adjustments. The share of major markets underperforming their historical average increased from 47% to 51% month-over-month per our Zonda Market Ranking, while entry-level and move-up home prices edged lower from a year ago. Mortgage rates fluctuated between 6.6% and 6.9%, adding another layer of uncertainty for buyers.
The more encouraging story came from the supply side of the market. Active community count increased 5% from a year ago, and relatively few builders report carrying excessive inventory anymore. Builders remain focused on controlling what they can by emphasizing value. For payment-sensitive buyers, that means leveraging financing tools, right-sizing floor plans, and offering homes with lower spec levels to keep costs and monthly payments more manageable. For buyers less constrained by monthly costs, the focus remains on delivering the best product, location, and lifestyle for the money.
“The housing market remains in wait-and-see mode,” said Ali Wolf, chief economist for Zonda and NewHomeSource. “Consumers still want to buy homes, but uncertainty is making them more cautious. Mortgage rate volatility, geopolitical tensions, the approaching midterm elections, and concerns about AI’s impact on the labor market continue to weigh on confidence. Until affordability improves or confidence returns, the market is likely to keep treading water.”
New home sales eased in July
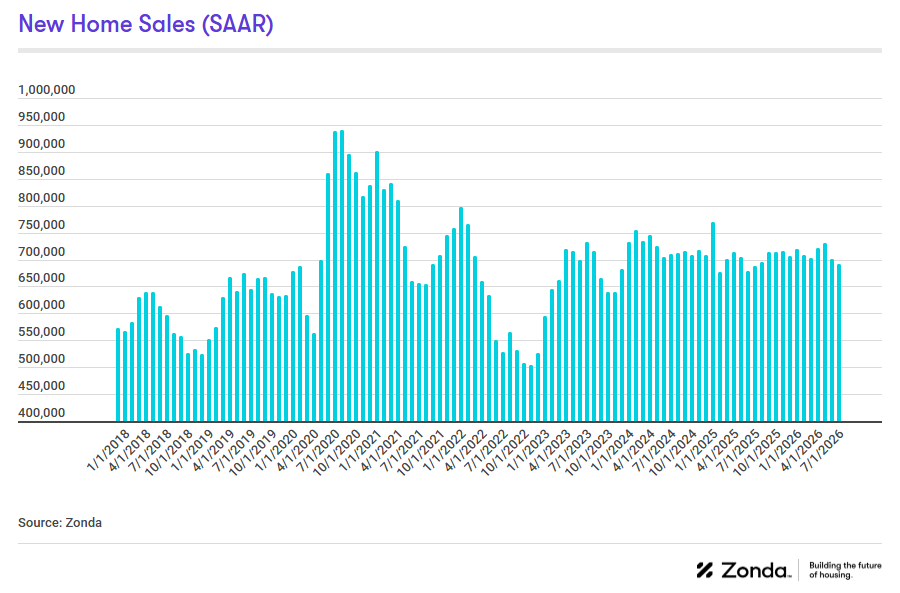
Zonda’s new home sales metric counts the number of new home contract sales each month and accounts for both cancellations and seasonality. This metric shows there were 690,958 new homes sold in July on a seasonally adjusted annualized rate. This was a decline of 1.4% from last month and a drop of 1.1% from a year ago. On a non-seasonally adjusted basis, 58,063 homes were sold, 0.7% lower than last year and 8.9% above the same month in 2019.
Incentives remain a key feature of the new home market, helping to sustain sales activity amid ongoing affordability pressures. In July, 63% of new home communities offered incentives on to-be-built homes and 81% on quick move-in supply. Note, these are only publicly available incentives so will underrepresent overall usage.
A market in neutral
Zonda’s New Home Pending Sales Index (PSI) was created to help account for fluctuations in supply by combining both total sales volume with the average sales rate per month per community. The July PSI came in at 131.9, representing a 0.9% decline from the same month last year. The index is currently 24.3% below cycle highs. On a month-over-month basis, seasonally adjusted new home sales were flat.
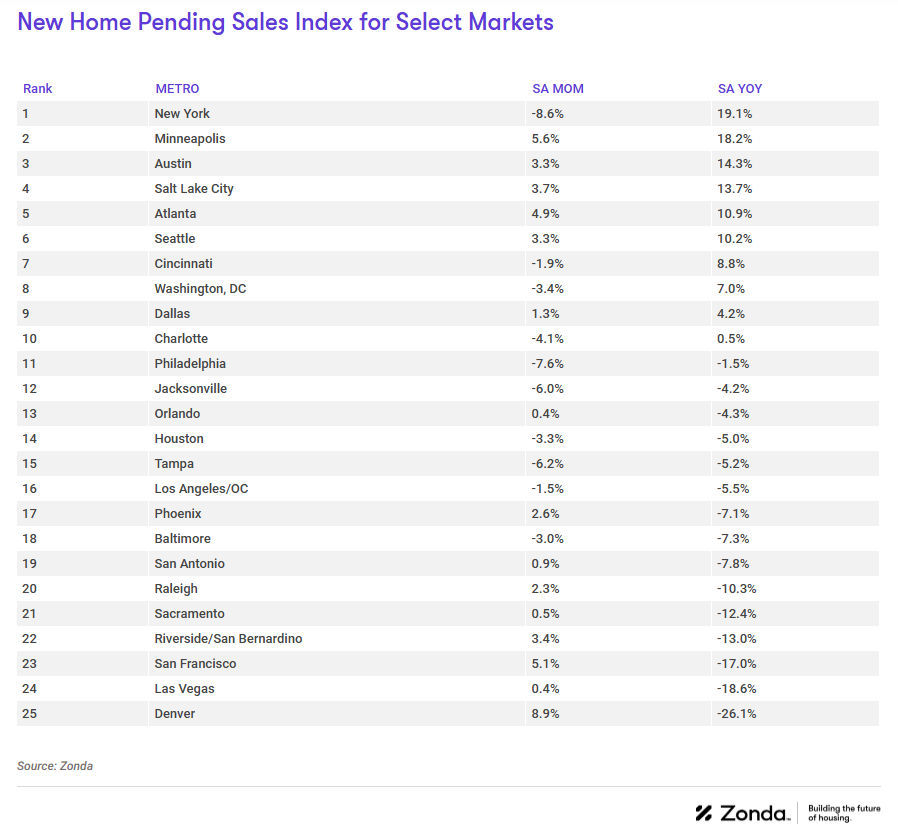
- The markets that posted the best numbers relative to last year were New York (+19.1%), Minneapolis (+18.2%), and Austin (+14.3%). New York was up compared to last year but fell 8.6% month-over-month.
- Inversely, the metros that performed the worst year-over-year were Denver (-26.1%), Las Vegas (-18.6%), and San Francisco (-17.0%).
- On a monthly basis, Denver, Minneapolis, and San Francisco were the best performing markets. Denver increased 8.9% relative to last month.
All three price tiers are now ranked average
In order to add further context to sales, Zonda created the Zonda Market Ranking (ZMR). The ZMR accounts for both sales pace and volume, is seasonally adjusted, and is taken as a percentage relative to a baseline market average. Based on the percentage above or below baseline, markets are bucketed into performance groups ranging from significantly underperforming to significantly overperforming relative to historical activity.
The map below shows a snapshot of top production markets by region. Zonda also offers the ZMR for entry-level, move-up/move-down, and high-end markets. Subscribers of the National Outlook report can access all top markets and the tiered breakdown in Zonda’s portal. Non-subscribers can access the tiered maps for the select 10 markets by clicking below.
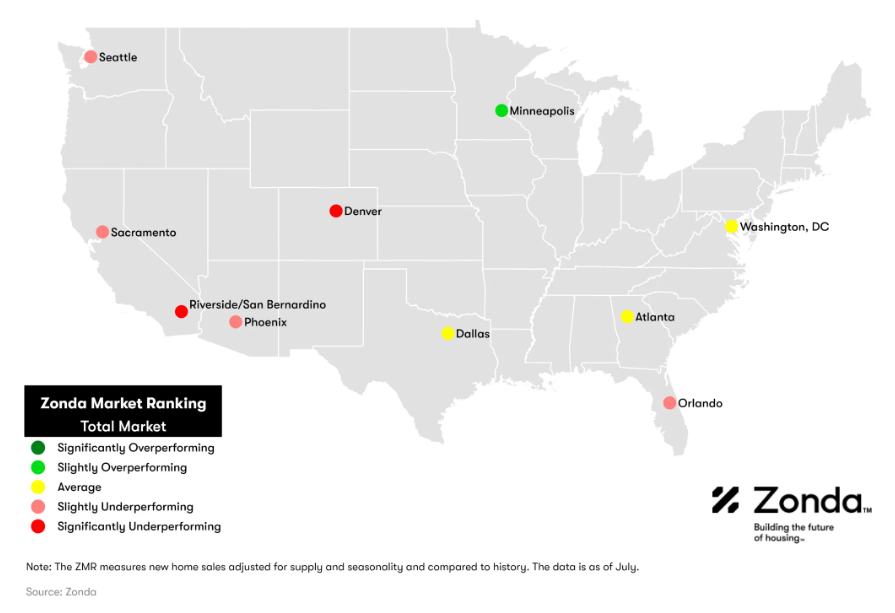
- The National ZMR index came in at 94.6 in July, which continued to indicate an average market.
- Zonda’s snapshot markets were split between 10% overperforming, 30% average, and 60% underperforming. Among Zonda’s top 55 major markets, 13% were overperforming, 36% were average, and 51% were underperforming.
- Importantly, the ZMR does not account for what it takes to sell a home. For example, securing a sale might still feel difficult in a significantly overperforming market, but if the incentives offered result in a sale, we count the sale.
Pricing growth continued to narrow
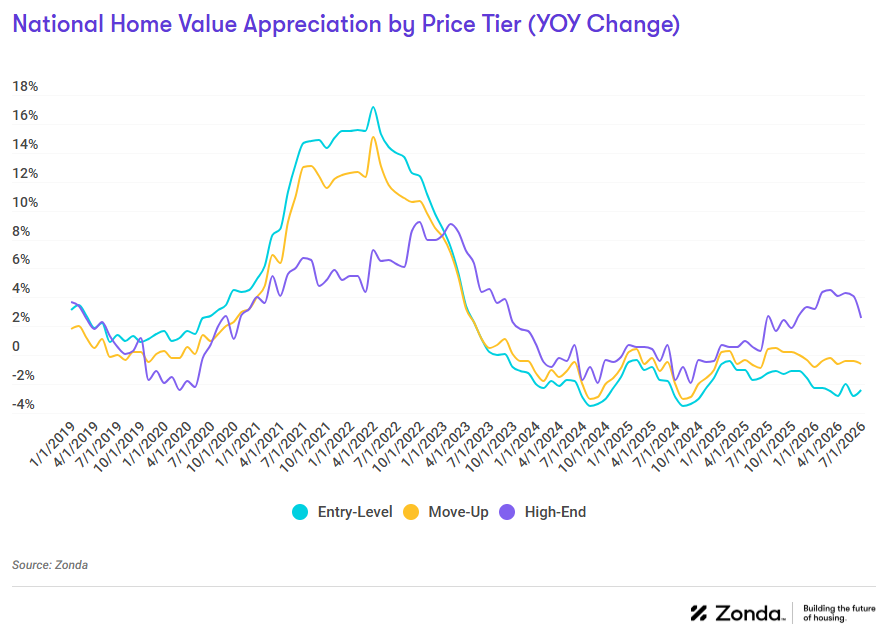
National home prices increased 2.6% year-over-year for high-end homes to $945,470. Prices fell 2.4% for entry-level homes to $317,715 and 0.6% for move-up homes to $515,192. The increase among higher-priced homes reflects a concentration of new communities opening at premium price points, along with larger homesites, bigger floor plans, and more desirable locations. Meanwhile, modest price declines in the entry-level and move-up segments suggest builders continue to prioritize affordability through incentives, product right-sizing, and more competitive pricing in response to softer buyer demand.
Supplementing our data with a survey Zonda conducts monthly, 25% of builders lowered prices in July month-over-month, 63% held prices flat, and 12% raised prices. In June, for comparison, 21% of builders lowered prices, 63% held prices flat, and 16% increased prices.
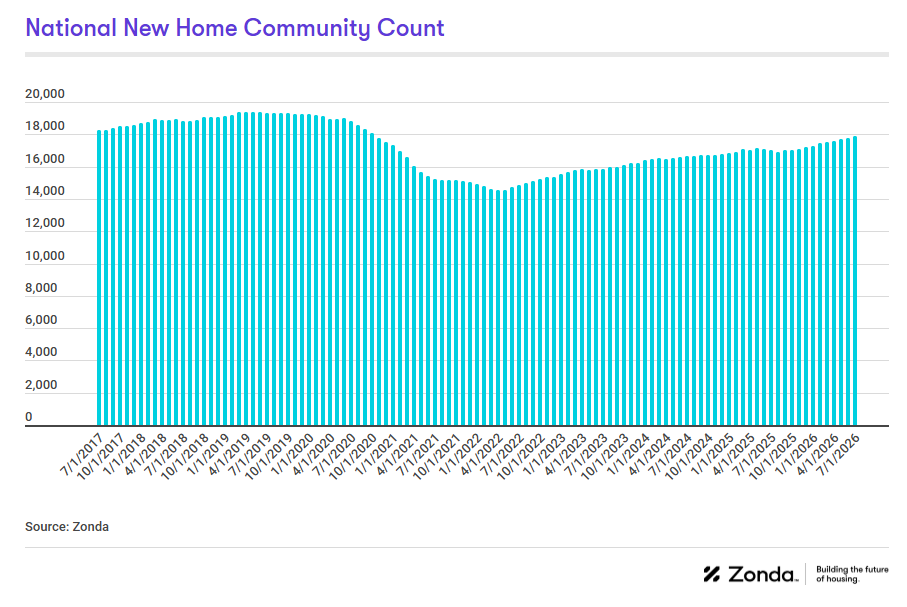
Community count increased for the 9th month straight
There are currently 17,869 actively selling communities tracked by Zonda, up 5.1% from last year. On a month-over-month basis, the national figure grew 0.6%. Total community count is 7.4% below the same month in 2019. Zonda defines a community as anywhere five or more units are for sale.
- San Jose (+50.0%), Miami (+38.3%), and Greenville (+24.4%) grew community count the most year-over-year.
- Relative to last year, the biggest community count declines were in Minneapolis (-8.7%), New York (-7.9%), and Baltimore (-7.9%).
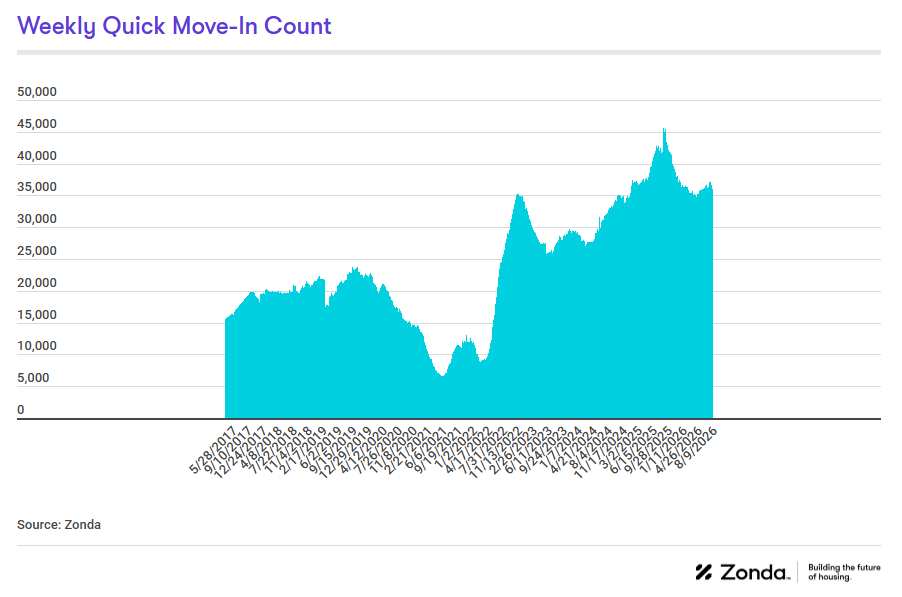
National quick move-ins (QMIs) totaled 36,033, down 9.9% compared to last year and 0.5% lower month-over-month. Over the past 18 months, builders have taken a more measured approach to spec home construction to avoid adding excess inventory amid a more challenging sales environment. Total QMIs are 63.8% above 2019 levels. QMIs are homes that can likely be occupied within 90 days.
- On a metro basis, 36% of Zonda’s select markets increased QMI count year-over-year.
- The markets that grew the most year-over-year were San Francisco (+54.5%), Cincinnati (+41.4%), and Philadelphia (+27.5%).
- Cincinnati, Las Vegas, and Riverside/San Bernardino have seen the most growth in QMIs compared to the same time in 2019, up 379.3%, 231.1%, and 179.4%, respectively.
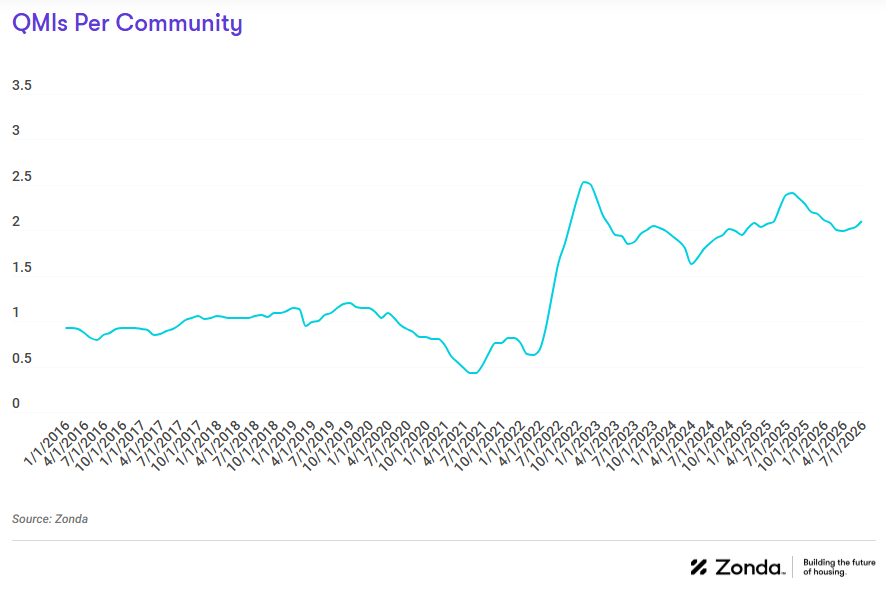
QMIs per community is a good way to track how new home supply looks in the context of actively selling projects. There were 2.1 QMIs per community nationally in July, down 7.9% compared to the same month last year.
Please note, the QMI per community data aligns with this report covering July trends. Our quick move-in data is weekly, and we release the latest available at the time of publishing this report. As such, recreating the visual below with the data above will yield slightly different results.
Are you interested in seeing past National Housing Market Update and Pending Sales Index reports? Access our report library to learn more.
Methodology
The Zonda New Home Pending Sales Index (PSI) is built on proprietary, industry-leading data that covers 85% of the production new home market across the United States. Reported number of new home pending contracts are gathered and analyzed each month. Released mid-month, the New Home PSI is a leading indicator of housing demand compared to closings because it is based on the number of signed contracts at a new home community. Zonda monitors 17,000 active communities in the country and the homes tracked can be in any stage of construction.
The new home market represents roughly 10% of all transactions, allowing little movements in supply to cause outsized swings in market activity. As a result, the New Home PSI blends the cumulative sales of activity recently sold-out projects with the average sales rate per community, which adjusts for fluctuations in supply. Furthermore, the New Home PSI is seasonally adjusted based on each market’s specific seasonality and removes outliers to reduce volatility. The index was re-benchmarked in June 2026, so PSI readings may differ from those reported in prior releases.
About Zonda
Zonda provides data-driven housing market solutions to the homebuilding industry. From builders to building product manufacturers, mortgage clients, and multifamily executives, we work hand-in-hand with our customers to streamline access to housing data to empower smarter decisions. As a leading brand in residential construction, our mission is to advance the home building industry, because we believe better homes mean better lives and stronger communities. Together, we are building the future of housing.