
BFS Reports 13.3% Decline in Manufacturing on 8.8% Overall Drop in Sales
Originally Published by: Builders FirstSource — July 30, 2026
SBCA appreciates your input; please email us if you have any comments or corrections to this article.
IRVING, Texas--(BUSINESS WIRE)-- Builders FirstSource, Inc. (NYSE: BLDR) today reported its results for the second quarter ended June 30, 2026. 
Second Quarter 2026 Highlights
All Year-Over-Year Comparisons Unless Otherwise Noted:
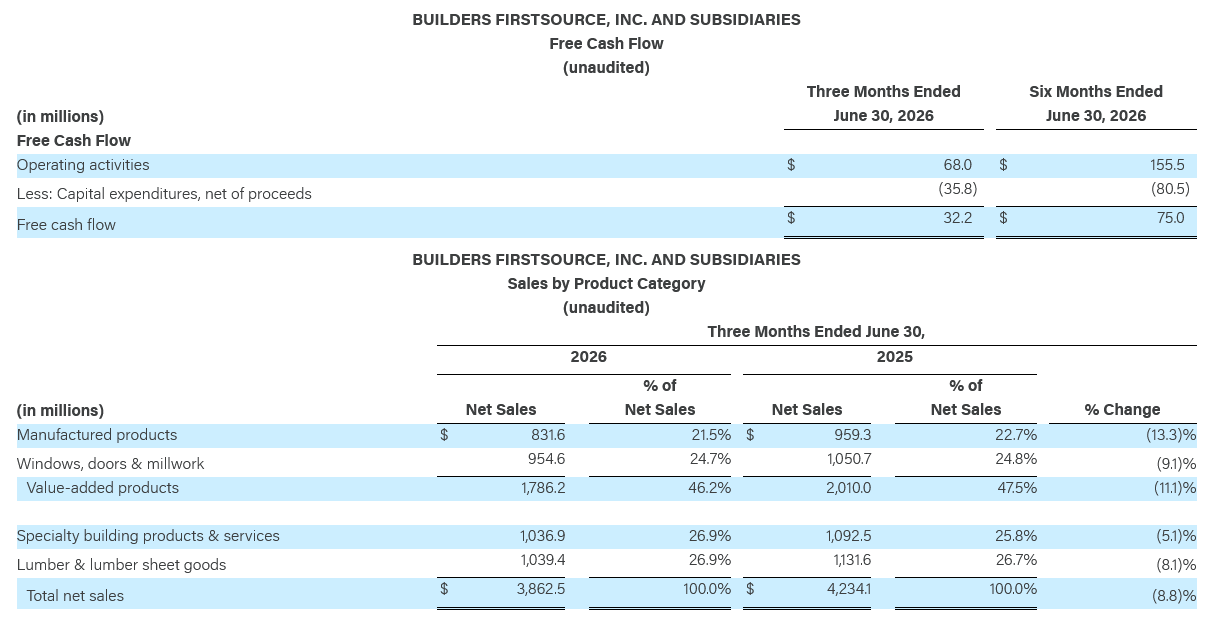
- Net sales were $3.9 billion, a decrease of 8.8%, primarily due to a lower housing starts environment and related headwinds. The decline reflects lower core organic net sales and commodity deflation, partially offset by growth from acquisitions.
- Gross profit was $1.1 billion, a decrease of 16.3%. Gross profit margin percentage decreased 260 basis points to 28.1%, primarily driven by a lower housing starts environment and related headwinds.
- Net income (loss) was $(3.9) million, or diluted EPS of $(0.04) compared to diluted EPS of $1.66 in the prior-year period. Net income (loss) as a percent of net sales decreased by 450 basis points to (0.1)%.
- Adjusted EBITDA decreased 34.9% to $329.3 million, primarily driven by lower gross profit.
- Adjusted EBITDA margin declined by 350 basis points to 8.5%, attributable to lower gross margin and reduced operating leverage.
- Cash provided by operating activities was $68.0 million, a decrease of $273.0 million compared to the prior-year period. The Company's free cash flow was $32.2 million, a decrease of 87.4%, compared to $255.0 million in the prior-year period. The decrease was primarily driven by lower net income, partially offset by lower capital expenditures.
“Despite the ongoing housing market headwinds, our second quarter results were in line with our expectations and reflect the strength of our differentiated platform and the adaptability of our operating model. We remain focused on the factors within our control, including managing the business with discipline, and leveraging both our technology capabilities and our value-added solutions. This approach continues to strengthen our position as a trusted, full-service partner to homebuilders,” commented Peter Jackson, CEO of Builders FirstSource.
Mr. Jackson continued, “While housing market conditions remain weak, we are continuing to invest in innovation and capabilities that enhance the customer experience, improve efficiency across the value chain, and reinforce our competitive advantage. Our business model is built to perform through the cycle, and we remain confident in our ability to outgrow the market over time and create sustainable, long-term value for our shareholders.”
Pete Beckmann, CFO of Builders FirstSource, added, “Our second quarter results demonstrate continued discipline through managing costs, working capital, and capital deployment. Given persistent housing affordability challenges and softer demand trends, our updated full-year outlook reflects current market conditions and a more cautious view of the second half. Importantly, our strong balance sheet, healthy free cash flow generation, and approach to capital allocation provide the flexibility to invest in high-return opportunities while navigating near-term uncertainty.”
Second Quarter 2026 Financial Performance Highlights
All Year-Over-Year Comparisons Unless Otherwise Noted:
Net Sales
- Net sales were $3.9 billion, a decrease of 8.8%, primarily due to a lower housing starts environment and related headwinds. The decrease reflects a 7.0% decline in core organic net sales, as well as commodity deflation of 2.7%, partially offset by growth from acquisitions of 0.9%.
- Core organic net sales declined 7.0%. Single Family declined 8.1%, Multi-Family declined 9.7%, and Repair and Remodel (“R&R”)/Other declined 1.8%. On a weighted basis, Single Family lowered net sales by 5.6%, Multi-Family by 1.0%, and R&R/Other by 0.4%.
Gross Profit
- Gross profit was $1.1 billion, a decrease of 16.3%. Gross profit margin percentage decreased 260 basis points to 28.1%, primarily driven by a lower housing starts environment and related headwinds.
Selling, General and Administrative Expenses
- SG&A was $958.3 million, a decrease of $29.5 million, or 3.0%, primarily driven by lower variable compensation as a result of decreased net sales and lower wages as a result of cost saving actions, partially offset by higher expenses associated with our ERP implementation and higher fuel expenses. As a percentage of net sales, total SG&A increased by 150 basis points to 24.8%, primarily attributable to reduced operating leverage.
Net Interest Expense
- Net interest expense increased $4.1 million to $76.1 million, primarily due to additional interest expense from purchase options exercised related to other finance obligations.
Income Tax Expense
- Income tax was $56.3 million, compared to $54.3 million in the prior-year period. The increase in income tax expense was primarily driven by an Internal Revenue Service research and development (R&D) settlement agreement concerning prior tax years, partially offset by a decrease in income before income taxes.
Net Income (Loss)
- Net income (loss) was $(3.9) million, or $(0.04) earnings per diluted share, compared to net income of $185.0 million, or $1.66 earnings per diluted share, in the prior-year period. The decrease in net income was primarily driven by lower gross profit and higher net interest expense, partially offset by lower SG&A.
- Net income (loss) as a percentage of net sales was (0.1)%, a decrease of 450 basis points from the prior-year period, primarily due to lower gross profit margin and higher net interest expense, partially offset by lower SG&A.
Adjusted Net Income
- Adjusted net income was $126.1 million, a decrease of 52.3%, primarily driven by lower gross profit and higher net interest expense, partially offset by lower SG&A and lower income tax expense after excluding the Internal Revenue Service R&D settlement agreement.
Adjusted Earnings Per Diluted Share
- Adjusted earnings per diluted share was $1.17, compared to $2.38 in the prior-year period. The 50.8% decrease was primarily driven by lower adjusted net income, partially offset by share repurchases.
Adjusted EBITDA
- Adjusted EBITDA decreased 34.9% to $329.3 million, primarily driven by lower gross profit.
- Adjusted EBITDA margin declined by 350 basis points from the prior-year period to 8.5%, primarily due to lower gross profit margin and reduced operating leverage.
Capital Structure, Leverage, and Liquidity Information
- For the three months ended June 30, 2026, cash provided by operating activities was $68.0 million, and cash used in investing activities was $49.3 million. The Company's free cash flow was $32.2 million, compared to $255.0 million in the prior-year period, largely the result of lower net income, partially offset by lower capital expenditures.
- Liquidity as of June 30, 2026, was approximately $1.6 billion, consisting of $1.5 billion in net borrowing availability under the revolving credit facility and $0.1 billion of cash on hand.
- As of June 30, 2026, LTM Adjusted EBITDA was $1.3 billion and net debt was $4.6 billion, resulting in a net debt to LTM Adjusted EBITDA ratio of 3.6x, compared to 2.3x in the prior-year period.
- The Company has $500 million remaining under its share repurchase authorization.
- Since the inception of its buyback program in August 2021, the Company has repurchased 102.6 million shares of its common stock, or 49.7% of its total shares outstanding, at an average price of $81.26 per share for a total cost of $8.3 billion, inclusive of applicable fees and taxes.
Productivity Savings From Operational Excellence
- For the second quarter, the Company delivered approximately $28 million in productivity savings related to operational excellence and supply chain initiatives.
- Year to date, the Company has delivered approximately $34 million in productivity savings.
- The Company expects to deliver $50 million to $70 million in productivity savings in 2026.
2026 Full Year Total Company Outlook
For 2026, the Company expects to achieve the financial performance highlighted below. Projected Net Sales and Adjusted EBITDA include the expected impact of price, commodities, and margins. We are not providing a quantitative reconciliation of our forward-looking guidance of adjusted EBITDA, adjusted EBITDA margin, adjusted effective tax rate, or free cash flow because we are unable to predict with reasonable certainty all the components required to provide such reconciliation without unreasonable efforts, which are uncertain and could have a material impact on GAAP reported results for the guidance period. See “Non-GAAP Financial Measures” for additional information.
- Net Sales to be in a range of $14.0 billion to $14.8 billion.
- Gross Profit margin to be in a range of 27.5% to 28.5%.
- Adjusted EBITDA to be in a range of $1.0 billion to $1.2 billion.
- Adjusted EBITDA margin to be in a range of 7.1% to 8.1%.
- Free cash flow of approximately $0.4 billion to $0.5 billion, assuming average commodity prices in the range of $390 to $410 per thousand board foot (mbf).
2026 Full Year Assumptions
The Company’s anticipated 2026 performance is based on several assumptions for the full year, including the following:
- Within the Company’s geographies, Single Family starts are projected to be down mid- to high-single digits, Multi-Family starts are projected to be down mid-single digits, and Repair & Remodel activity is projected to be down 1%.
- Acquisitions completed within the last twelve months are projected to add net sales growth of approximately 1%.
- Total capital expenditures in the range of $175 million to $225 million.
- Interest expense in the range of $280 million to $290 million.
- An adjusted effective tax rate of 22% to 24%.
- Depreciation and amortization expenses in the range of $580 million to $610 million.
- No change in selling days versus 2025.
About Builders FirstSource
Builders FirstSource (NYSE: BLDR), headquartered in Irving, Texas, is the nation's leading provider of building materials for professional builders in new residential construction and repair and remodeling. We deliver integrated homebuilding solutions by manufacturing, supplying, and installing a full range of structural and related building products. With approximately 565 locations across 43 states, we serve 48 of the top 50 and 91 of the top 100 Core Based Statistical Areas (CBSAs), ensuring broad geographic coverage and enhancing our ability to partner with our customers. Our leading network of strategically located manufacturing facilities produces factory-built roof and floor trusses, wall panels, vinyl windows, custom millwork and trim, manufactured and semi-custom modular homes, as well as engineered wood that we design and cut specifically for each home. We also assemble interior and exterior doors into pre-hung units for easy installation. Additionally, we distribute a wide range of building products, including lumber, sheet goods, windows, doors, millwork, and specialty items. Our services, which vary by market, include professional installation, turnkey framing, and shell construction. Supported by the latest construction innovations and digital solutions, we help drive greater efficiency across homebuilding. Learn more at www.bldr.com.