Charts: Single-Family Permits Decline Further in July
Originally Published by: NAHB — September 15, 2023
SBCA appreciates your input; please email us if you have any comments or corrections to this article.
Over the first seven months of 2023, the total number of single-family permits issued year-to-date (YTD) nationwide reached 527,158. On a year-over-year (YoY) basis, this is 18.4% below the July 2022 level of 645,877.

Year-to-date ending in July, single-family permits declined in all four regions. The Northeast posted the lowest decline of 12.1%, while the West region reported the steepest decline of 25.1%. The South declined by 16.5% and the Midwest declined by 18.0% in single-family permits during this time. For multifamily permits, the South region posted a modest decline of 7.5% while the West declined by 14.1%, the Midwest declined by 20.8%, and the Northeast declined by 31.2%.
Between July 2022 YTD and July 2023 YTD, except for Hawaii (+16.1%), all the other states and the District of Columbia reported declines in single-family permits. The range of declines spanned 1.5% in Maryland to 49.3% in Alaska. The ten states issuing the highest number of single-family permits combined accounted for 63.9% of the total single-family permits issued. Texas, the state with the highest number of single-family permits issued, declined 20.3% in the past 12 months while the next two highest states, Florida and North Carolina declined by 18.8% and 10.3% respectively.

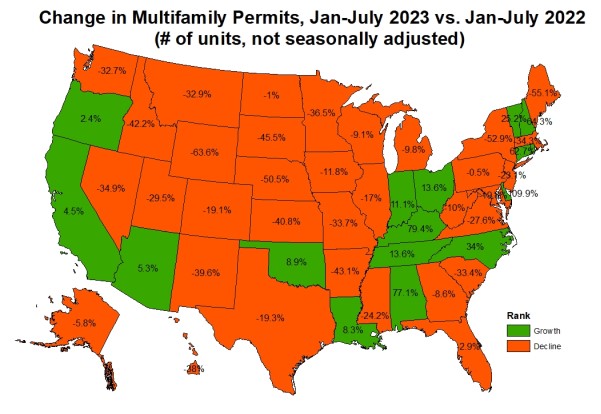
Year-to-date, ending in July, the total number of multifamily permits issued nationwide reached 337,730. This is 14.3% below the July 2022 level of 394,215.
Between July 2022 YTD and July 2023 YTD, 16 states recorded growth, while 34 states and the District of Columbia recorded a decline in multifamily permits. Rhode Island (+150.0%) led the way with a sharp rise in multifamily permits from 126 to 315 while Wyoming had the largest decline of 63.6% from 302 to 110. The ten states issuing the highest number of multifamily permits combined accounted for 64.8% of the multifamily permits issued. Texas, the state with the highest number of multifamily permits issued, declined 19.3% in the past 12 months while the next two highest states, Florida declined by 2.9% and California increased by 4.5%.
At the local level, below are the top ten metro areas that issued the highest number of single-family permits.
| Top 10 Largest SF Markets | July-23 (# of units YTD, NSA) | YTD % Change (compared to July-22) |
| Houston-The Woodlands-Sugar Land, TX | 29,687 | -8% |
| Dallas-Fort Worth-Arlington, TX | 24,088 | -19% |
| Atlanta-Sandy Springs-Roswell, GA | 14,417 | -14% |
| Phoenix-Mesa-Scottsdale, AZ | 13,302 | -33% |
| Charlotte-Concord-Gastonia, NC-SC | 11,174 | -13% |
| Orlando-Kissimmee-Sanford, FL | 10,020 | -9% |
| Austin-Round Rock, TX | 9,202 | -39% |
| Nashville-Davidson–Murfreesboro–Franklin, TN | 8,669 | -17% |
| Tampa-St. Petersburg-Clearwater, FL | 8,050 | -22% |
| Raleigh, NC | 7,639 | -10% |
For multifamily permits, below are the top ten local areas that issued the highest number of permits.
| Top 10 Largest MF Markets | July-23 (# of units YTD, NSA) | YTD % Change (compared to July-22) |
| New York-Newark-Jersey City, NY-NJ-PA | 17,802 | -43% |
| Dallas-Fort Worth-Arlington, TX | 15,567 | -23% |
| Houston-The Woodlands-Sugar Land, TX | 11,897 | -22% |
| Phoenix-Mesa-Scottsdale, AZ | 11,608 | 7% |
| Los Angeles-Long Beach-Anaheim, CA | 10,925 | -5% |
| Austin-Round Rock, TX | 10,895 | -32% |
| Miami-Fort Lauderdale-West Palm Beach, FL | 10,266 | 25% |
| Atlanta-Sandy Springs-Roswell, GA | 10,000 | 0% |
| Washington-Arlington-Alexandria, DC-VA-MD-WV | 7,347 | -27% |
| Denver-Aurora-Lakewood, CO | 7,148 | -16% |