JBREC Provides 2025 Forecast Report & How 2026 is Already Shifting
Originally Published by: John Burns Research & Consulting (JBREC) — March 27, 2026
SBCA appreciates your input; please email us if you have any comments or corrections to this article.
We hold ourselves accountable by comparing our forecasts against actual results, because our clients deserve to know where we got it right and where we didn't.
Our forecasts are built from the bottom up, drawing on metro-level data, proprietary surveys, boots-on-the-ground consulting work, and our data science team's ongoing model refinement.  We also engage constantly with our clients across the housing ecosystem, from homebuilders to lenders to rental operators to building products manufacturers and distributors.
Our 2025 report card compares our original thesis to how the year actually played out nationally, benchmarked to our February forecasts—when we use full prior-year data to set our official outlook for the year ahead.
Summary
-
Macro: We nailed mortgage rates (exactly 6.6%) and called a slowing-but-no-recession labor market—but demand
fell harder than we expected as macro uncertainty eroded buyer confidence. -
New construction: We called the slowdown early. New home sales1 and single-family starts both fell in 2025, consistent with our muted outlook—our homebuilder survey and land market research had signaled the pullback months in advance.
-
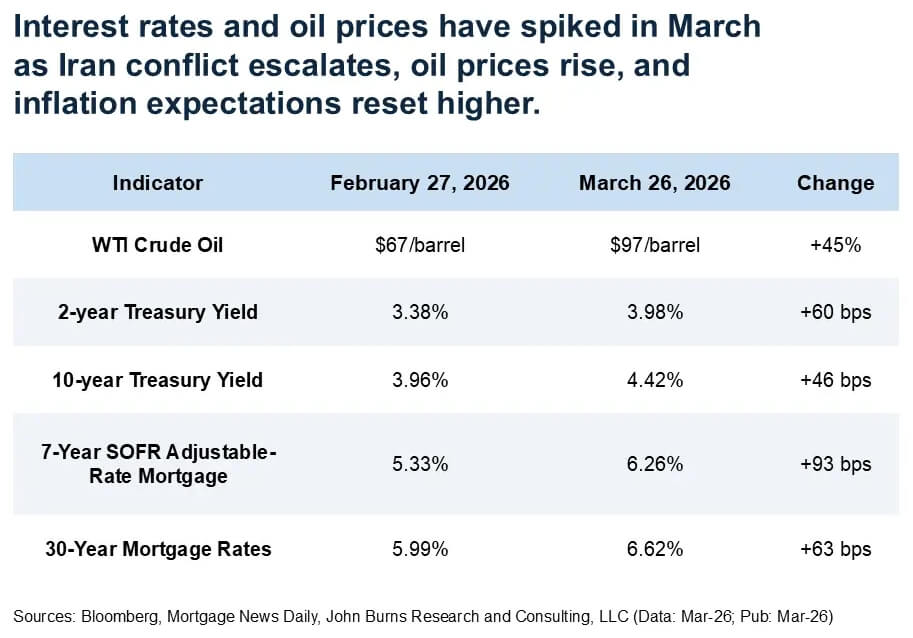
2026: muted—and getting murkier. Our outlook was already cautious before March; rising oil prices, spiking mortgage rates, and a slow spring selling season are putting further downward pressure on our starts forecast.
Macroeconomy: we got the big picture right
Job growth: slowing, but no recession
2025 JBREC forecast: +1.1%
2025 actual: +0.5%
Entering 2025, we expected a slowing labor market with historically weak job growth, and that’s what happened:
-
At +0.5% annual average, 2025 had one of the weakest years for job growth outside of a recession.
-
Our forecast of +1.1% annual average was too high, but the directional call was correct: a slowing labor market, but no recession.
Mortgage rates: Spot on despite a volatile path
2025 JBREC forecast: 6.6% annual average (30-year fixed)
2025 actual: 6.6% annual average (30-year fixed)
Our mortgage rate forecast is informed by bond market pricing for 10-year treasuries and our view of the spread between treasury yields and mortgage rates, which we correctly expected to remain above its historical average in 2025.
The path to the 6.6% annual average was turbulent—impacting demand for housing.
-
The Fed cut rates in December 2024, but instead of falling, mortgage rates rose above 7% into early spring and hovered above 6.5% for most of the year.
-
Tariff policy uncertainty, questions around Fed independence, and a potential reacceleration in the economy rattled the bond market and pushed long-term inflation expectations higher.
-
Even though the annual average landed where we expected, the underlying macro turbulence eroded consumer confidence and weakened buyer urgency just as the spring selling season was getting underway.
New home market: early call on the slowdown
New home sales
2025 JBREC forecast: 0% (flat) YOY
2025 actual: -1% YOY
We forecasted flat YOY new home sales in 2025. Actual new home sales came in at -1% YOY. Our proprietary homebuilder survey (which captures insights on ~15%–20% of all new home sales nationally each month), along with public builder earnings and guidance, pointed to a muted year. Heading into 2025, our homebuilder survey showed rising unsold new home inventory, softening buyer traffic, and weakening pricing power. These trends signaled that the market was losing momentum.
Single-family starts
2025 JBREC forecast: -3% YOY
2025 actual: -7% YOY
We forecasted single-family starts at -3% YOY vs. the actual -7% YOY. The same demand-side conditions that weighed on new home sales also pointed to a pullback in construction activity, and our land market research confirmed it.
Through our proprietary land survey and the land banking2 work our consulting team does across the country, we saw builders slow land acquisition activity, push out takedown schedules, and renegotiate deal terms with land sellers. New home prices fell broadly in 2025, and builder margins compressed as elevated supply and weaker demand squeezed profitability.
Construction costs declined YOY in the second half of 2025 for the first time in our homebuilder survey history going back to 2013. Soft demand and excess new home supply reduced pricing pressure across the construction cost chain, with relief primarily coming from the labor side as trades competed for less work. Builders responded by cutting spec starts and pulling back on new construction to recalibrate to a weaker demand environment.
Resale market: demand softer than expected
Resale sales
2025 JBREC forecast: +3% YOY
2025 actual: 0% (flat) YOY
Resale prices
2025 JBREC forecast: +2.3% YOY
2025 actual: +0.6% YOY
Coming into the year, we expected the lock-in effect3 to continue to slowly wane, supporting modest growth in transaction volumes despite ongoing broad-based affordability challenges. Instead, the labor market weakened more than anticipated, macro uncertainty spiked, reducing buyer urgency, and household formation4 slowed as fewer new households formed5 and foreign immigration declined more than we initially projected. In a market already sitting on elevated resale supply, that softer demand translated directly into weaker price growth.
Rental market: excess supply and weak demand cooled rent growth
Job growth is one of the key drivers of rent growth, and at +0.5% annual average, 2025 delivered far less fuel than we initially anticipated. Reduced international immigration further weakened renter household demand, as most new immigrant households are renters. These dynamics weighed on both single-family and apartment rents.
Single-family new lease asking rent growth
2025 JBREC forecast: +3.0% YOY
2025 actual: +1.9% YOY
In early 2024, we warned that single-family rent growth would moderate, particularly in markets experiencing rapid expansion in for-sale and for-rent supply. Our thesis proved correct: as resale listings6 rose in 2025, some unsold homes transitioned into rentals, adding rental supply and putting downward pressure on rent growth. While our directional call was accurate, rent growth decelerated more quickly than anticipated as weaker job growth and reduced immigration compounded the supply-side pressure.
Apartment effective rent growth
2025 JBREC forecast: +1.5% YOY
2025 actual: +0.2% YOY
We anticipated that declining lease-up inventory throughout 2025 would lead to greater pricing power by year-end. While apartment absorption remained near record levels, it largely kept pace with record new deliveries rather than exceeding them. Weaker job growth, reduced foreign immigration, and softer consumer sentiment prevented the supply burn-off we expected. The continuously elevated lease-up inventory has kept concessions widespread and difficult to unwind, eating into returns.
Repair and remodel: a muted year as expected
R&R Spend (excluding labor, excluding disaster)
2025 JBREC forecast: +1.1% YOY
2025 actual: N/A (no single industry benchmark)
Coming into 2025, we forecasted weak growth in repair-and-remodel spend, and the market validated that call throughout the year. While no single dataset captures the full R&R market, the signals we tracked consistently supported our muted outlook. Home improvement bellwethers like Home Depot and Lowe’s reported tepid demand on their 2025 earnings calls, and building products manufacturers broadly noted weak remodeling activity. Our proprietary remodeling surveys told a similar story, capturing weakening demand and slowing activity throughout the year. Consumer uncertainty, high financing costs, declining home prices in many parts of the country, and tariff-driven materials cost volatility all weighed on homeowner willingness to take on projects, keeping R&R growth subdued.
2026: another muted year ahead
Our outlook for 2026 calls for another muted year in housing. Consumer uncertainty remains a key headwind, the labor market is soft (though we’re still not calling for a recession), and affordability constraints persist. Our homebuilder survey shows unsold new home inventory near its highest level since early 2011, and many of the same dynamics that shaped our muted 2025 outlook remain in play.
That forecast was set earlier in the year, before conditions deteriorated further in March. Since then:
- The escalation of the Iran conflict has pushed oil prices higher, which in turn has reset inflation expectations and driven interest rates up across the yield curve.
- Mortgage rates have spiked, and early reads on the spring selling season from our builder conversations point to a muted start.
- The longer energy prices remain elevated, the more likely these pressures ripple out to consumer sentiment and broader housing demand. Rising energy costs also put upward pressure on construction costs, which could further squeeze builder margins and weigh on starts.
- We are already revisiting our single-family starts forecast in response to what we are hearing and seeing so far this year.
The bottom line: 2026 may be softer than our already cautious baseline suggests.
Our full 2026–2029 national and metro-level forecasts are available in our research reports. Contact us to access our research, learn more about our services, or speak to one of our experts about how we can help your business.
The full scorecard
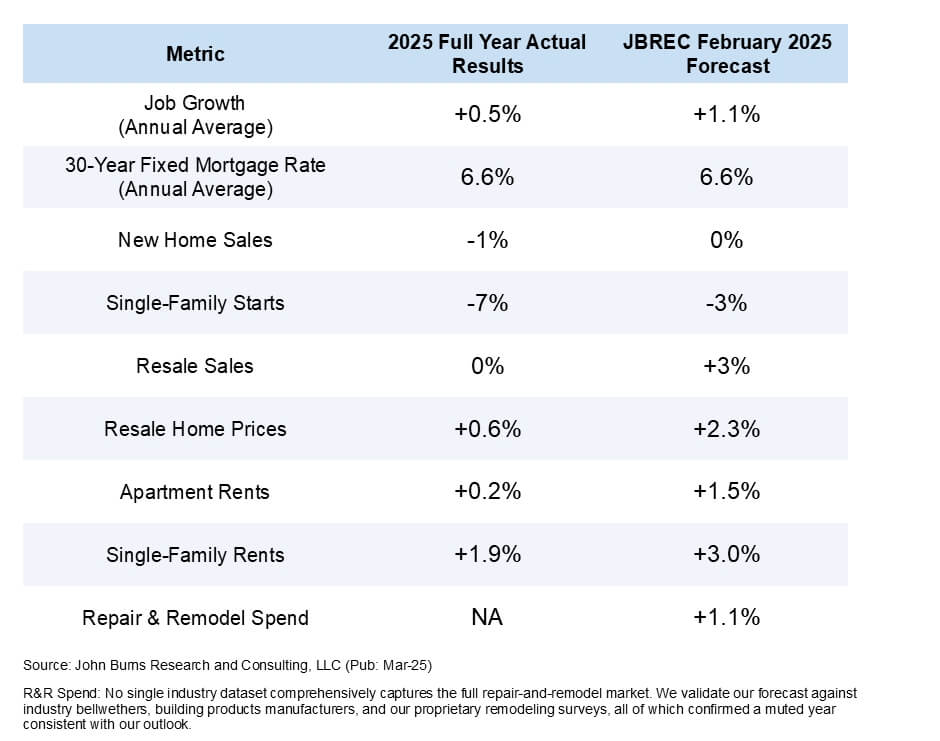
Our February 2025 forecasts for the full year vs. 2025 actuals
We benchmark against our February forecasts, as that is when we receive full prior-year data and set our official outlook for the year ahead.
- ^ Sales include actual closings of attached and detached units unless otherwise noted. New home sales are a lagging indicator comparison to permits.
- ^ A financial arrangement in which investors buy land on behalf of homebuilders or developers and earn a fee to hold the land until the client is ready to use the asset. In some cases, the land banker or the builder/developer will advance the approvals and site development work, which increases the value of the asset while it remails in the land bank.
- ^ Homeowners with low-rate 30-year mortgages may balk at selling their homes when rates are high because they want to keep their advantageous low rates and monthly payments. This resistance limits the inventory of resale homes offered for sale.
- ^ The creation of a new household unit. Households form as people move away from their parents, split up with or move in with cohabitants, or move to a different geographic area. It also refers to the net change in households in a geographic area due to people moving in or out of the area, population changes, consolidating households (e.g., getting roommates), or disaggregating households (roommates splitting up into separate housing units).
- ^ All the people who live together in a single housing unit. A household can include related (children and parents, etc.) and unrelated (roommate, partner, friend, etc.) people. An individual occupying a unit alone will count as one household. Conversely, a group sharing a unit will also count as one household. By definition, a household can occupy only one housing unit as a full-time residence.
- ^ Sales include actual closings of attached and detached units unless otherwise noted. New home sales are a lagging indicator in comparison to permits.