June Home Sales Rise 5% in June, Up 2.5% Year-Over-Year
Originally Published by: HBS Dealer — July 20, 2026
SBCA appreciates your input; please email us if you have any comments or corrections to this article.
June brought a stronger pace of home sales across the U.S., while inventory continued to rise at a measured rate. According to the June REMAX National Housing Report, home sales rose 8.9% from May and 7.8% from June 2025. Active inventory also increased, rising 5.0% month over month and 2.5% year over year. At the same time, new listings dipped 1.9% from May but were 2.4% higher than one year earlier, pointing to a market with more movement but not a dramatic shift in supply.
The June report suggests that buyers and sellers were both active as summer got underway. The median sales price was $460,000, up 2.4% from May and 2.2% from last June. Buyers paid an average of 99% of asking price, the same as May and a year ago. Months' supply of inventory was 2.7, up from May but the same as in June 2025, reinforcing that while options improved in some metros, the market remained competitive in many others.
"June's housing data points to a market with stronger momentum but not a broad supply reset," said Chris Lim, REMAX President and Chief Growth Officer. "Sales picked up, inventory continued to expand and prices remained steady year over year. For consumers, that means local conditions still matter. In a market like this, timing, pricing and strategy can vary significantly from one area to the next, and that's where guidance from a real estate professional can make a meaningful difference."
Additional market indicators include:
- Average days on market was 43 days, one day longer than May and two days longer than June 2025.
- Median listing price of new listings was $465,000, down 2.1% from May and flat year over year.
Highlights and local market results for June include:
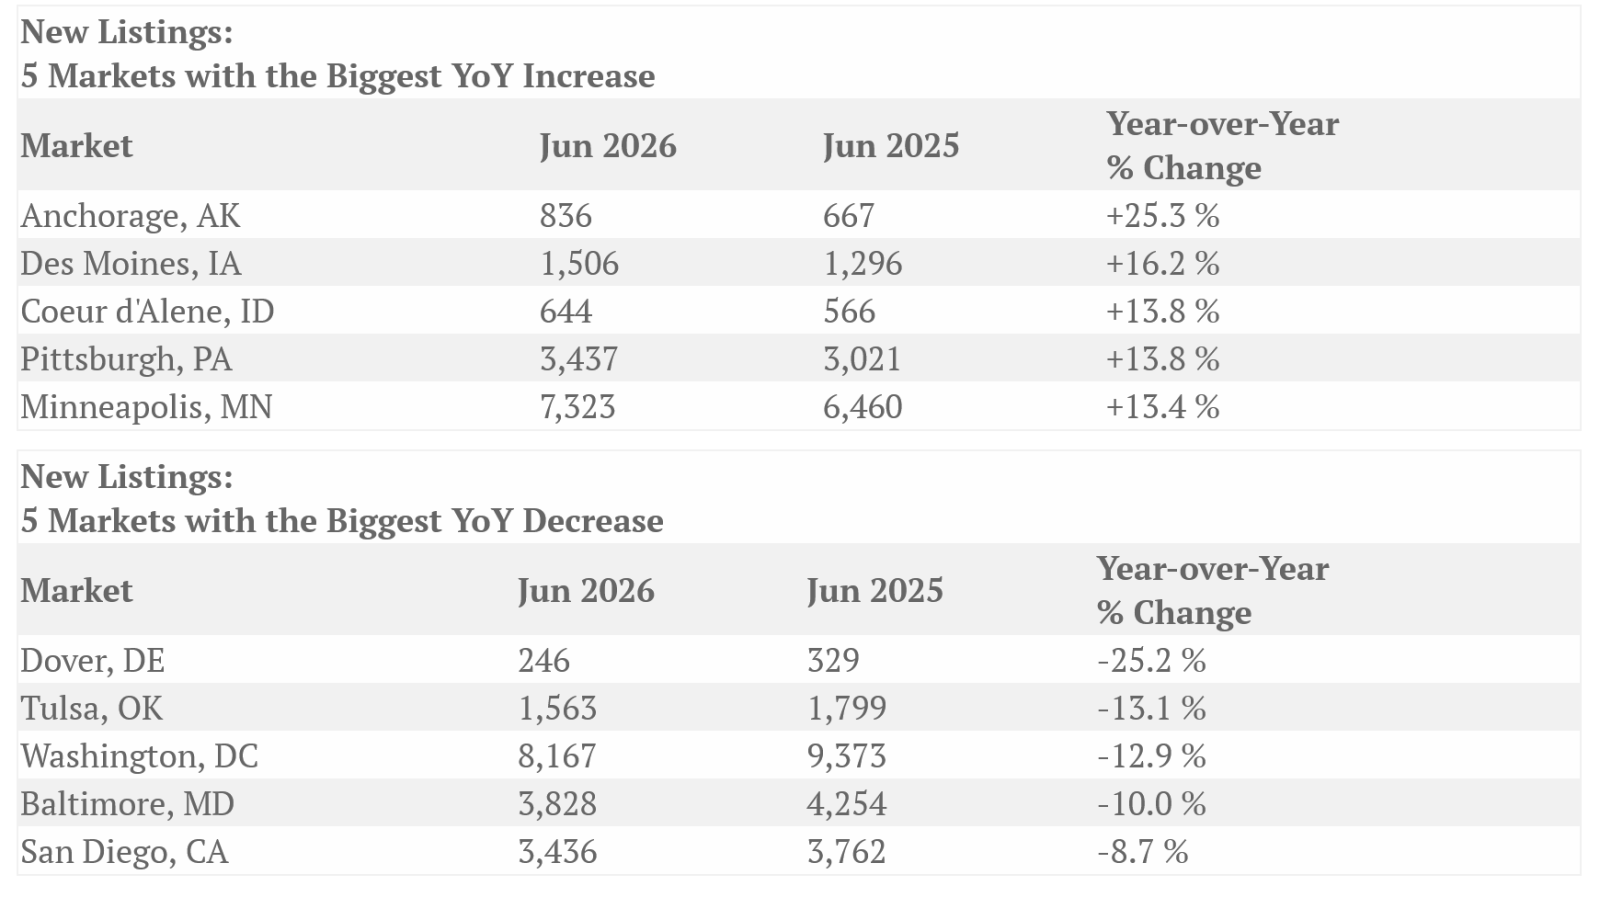
New Listings
In the 47 metro areas surveyed in June 2026, the number of newly listed homes was down an average of 1.9% compared to May 2026 and up 2.4% compared to June 2025. The markets with the biggest increase and decrease in year-over-year new listings percentage were:
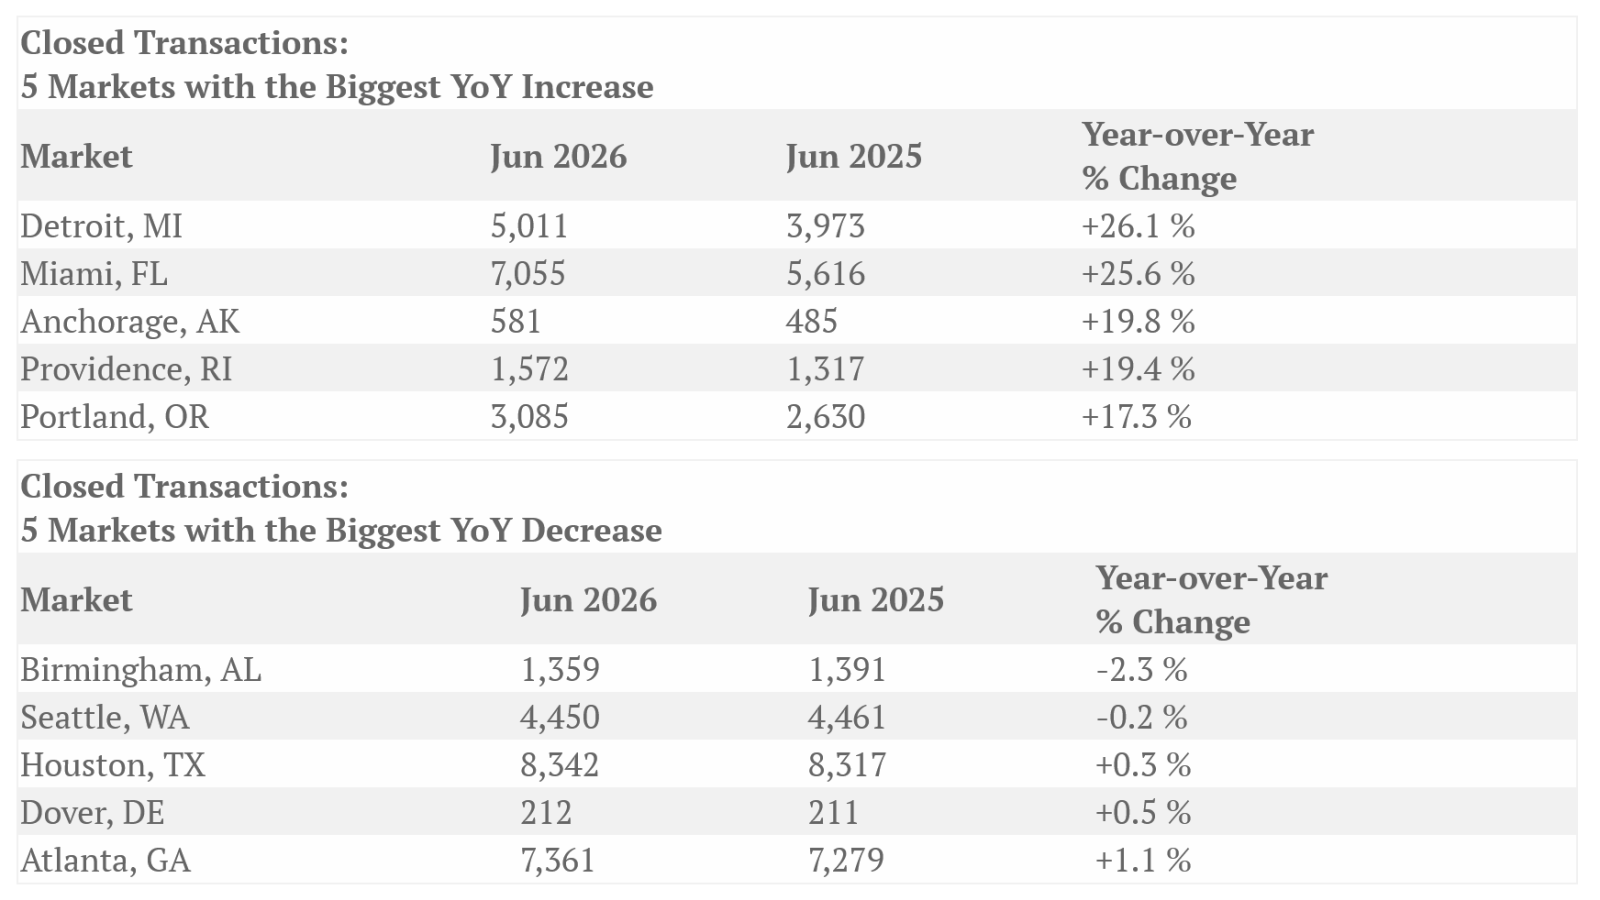
Closed Transactions
Of the 47 metro areas surveyed in June 2026, the overall number of home sales was up an average of 8.9% compared to May 2026 and up 7.8% compared to June 2025. The markets with the biggest increase and decrease in year-over-year sales percentage were:
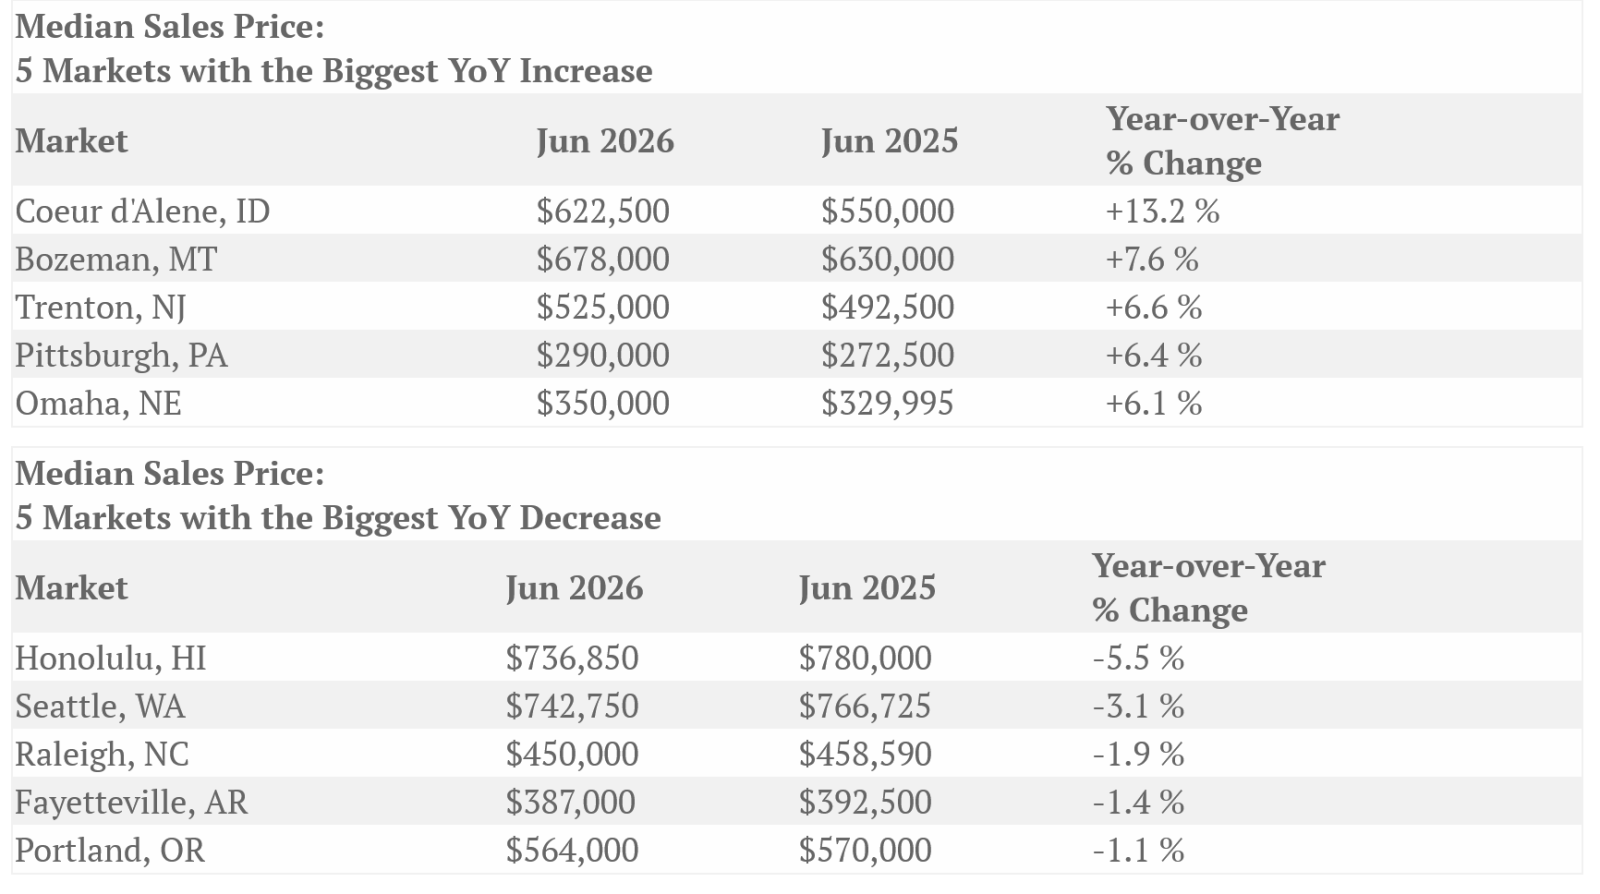
Median Sales Price – Median of 47 metro area prices
In June 2026, the median of all 47 metro area sales prices was $460,000 up 2.4% compared to May 2026 and up 2.2% from June 2025. The markets with the biggest increase and decrease in year-over-year median sales price were:
Close-to-List Price Ratio – Average of 47 metro area prices
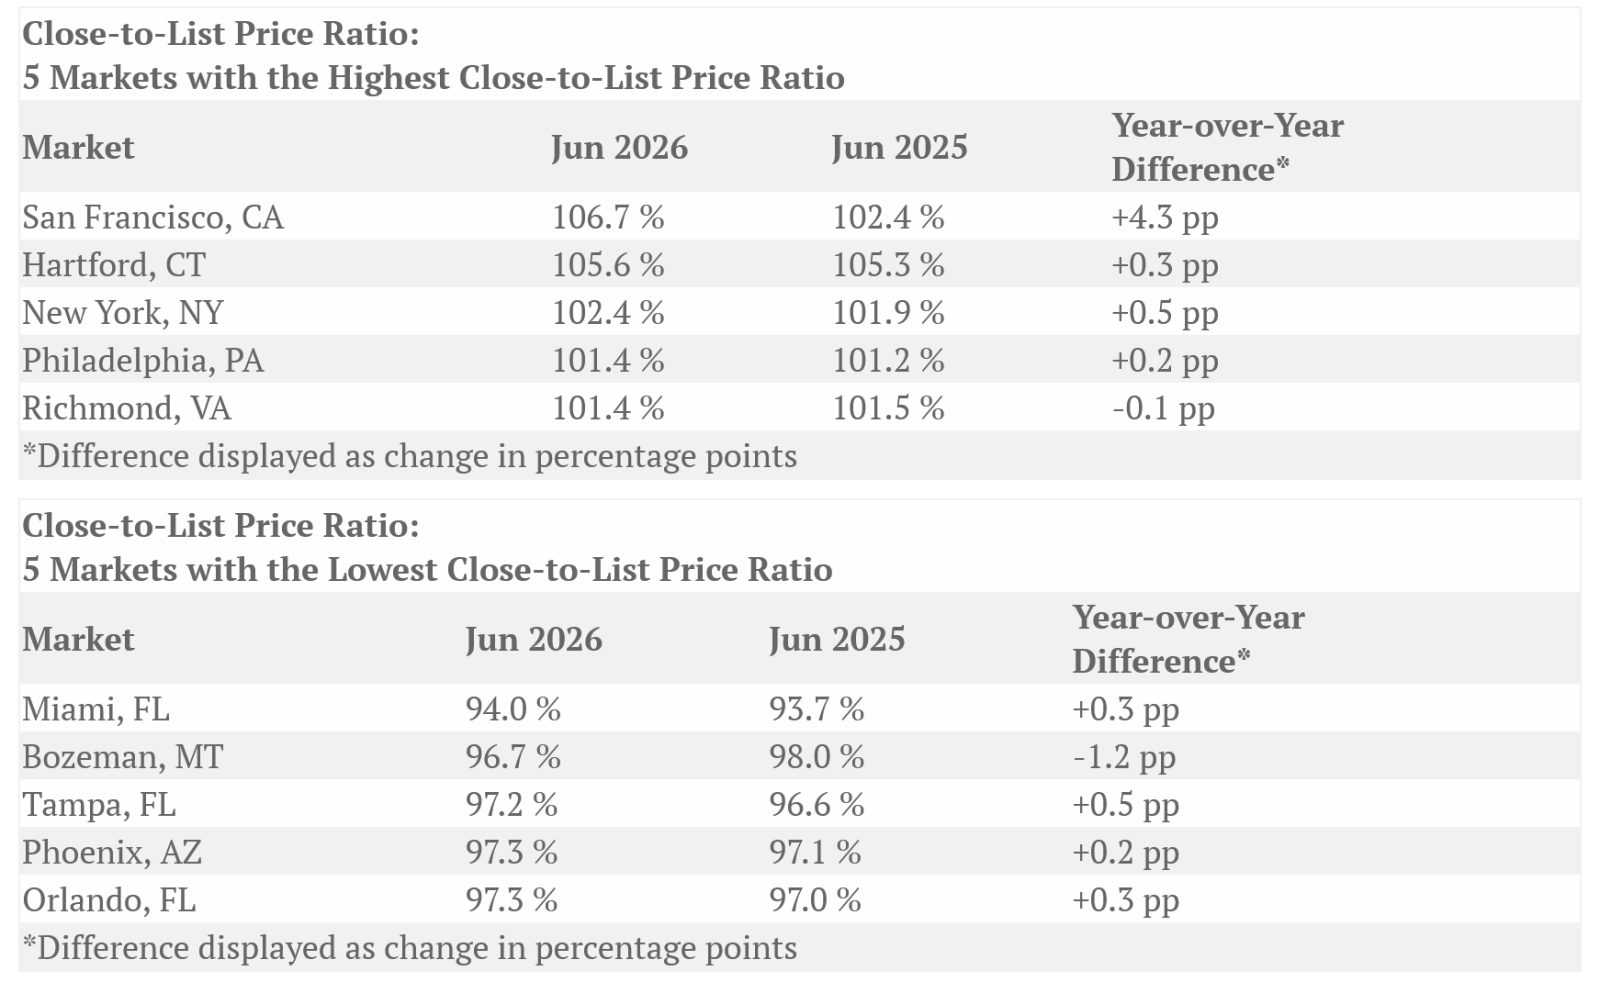
In June 2026, the average close-to-list price ratio of all 47 metro areas in the report was 99%, the same as May 2026 and June 2025. The close-to-list price ratio is calculated by the average value of the sales price divided by the list price for each transaction. When the number is above 100%, the home closed for more than the list price. If it's less than 100%, the home sold for less than the list price. The metro areas with the highest and lowest close-to-list price ratios were:
Days on Market – Average of 47 metro areas
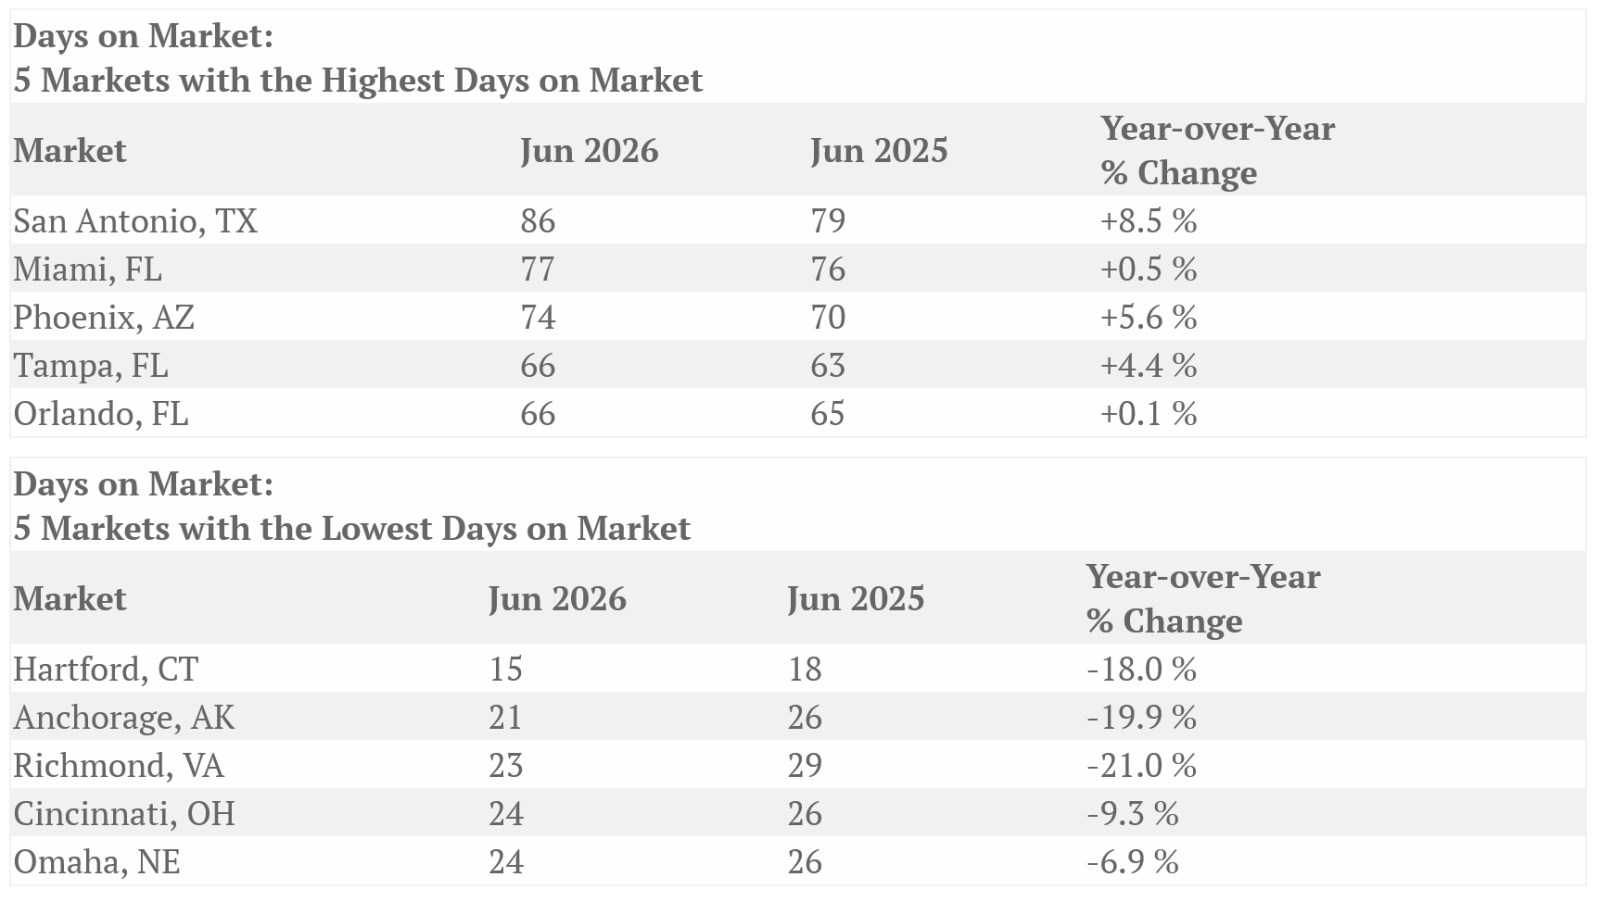
The average days on market for homes sold in June 2026 was 43 up one day compared to May 2026 (42 days) and up two days compared to the average in June 2025 (41 days). Days on market is the number of days between when a home is first listed in an MLS and a sales contract is signed. The metro areas with the highest and lowest days on market averages were:
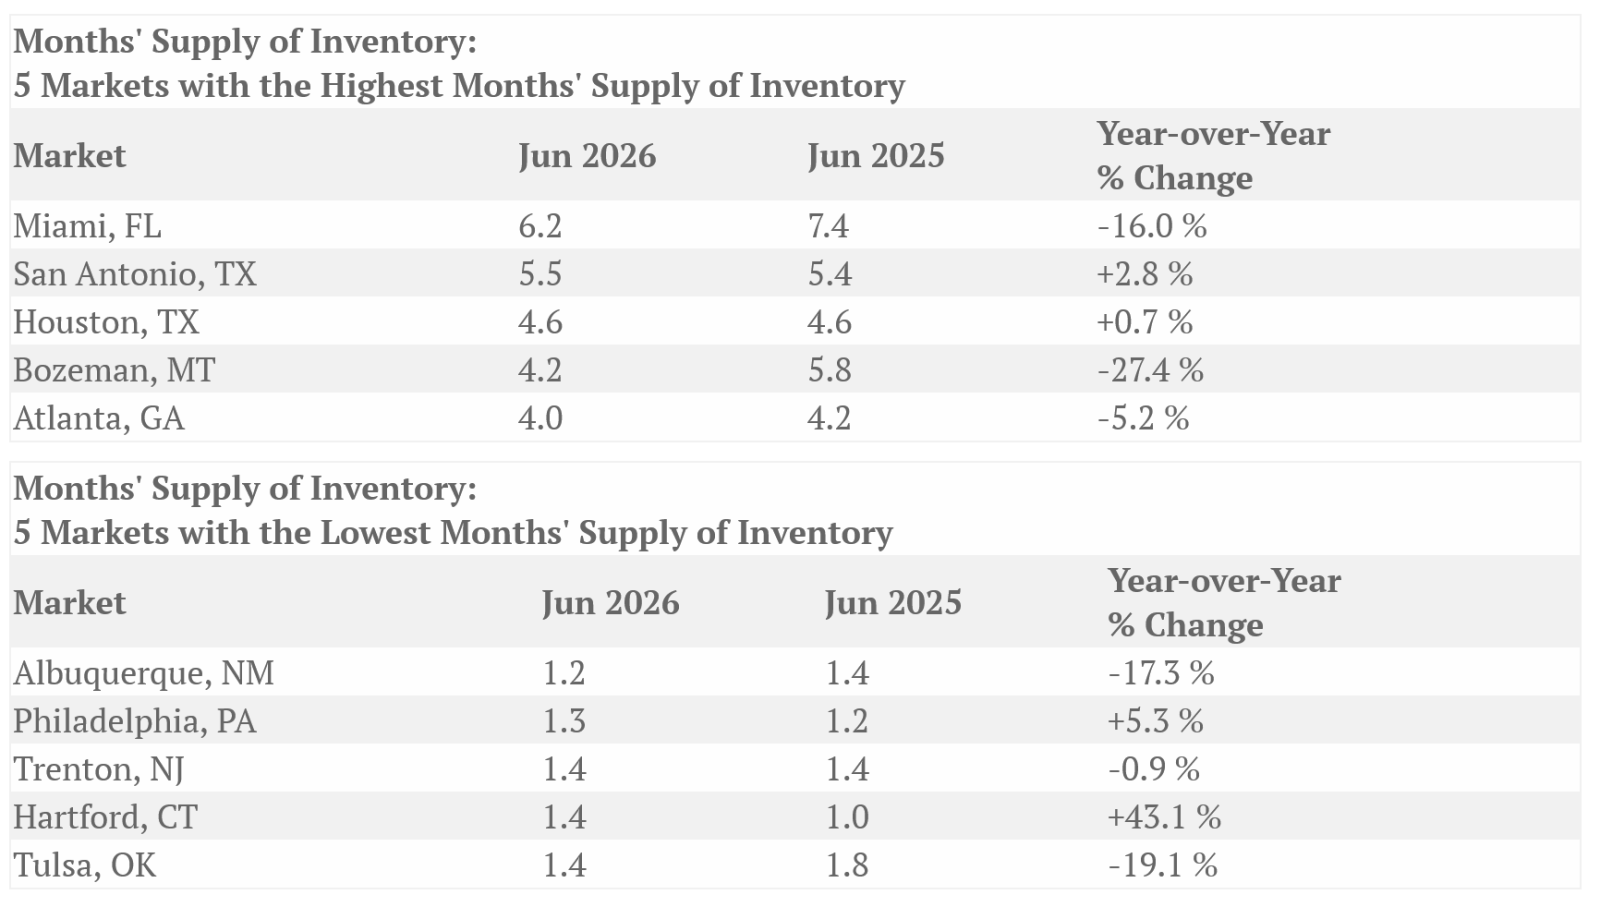
Months' Supply of Inventory – Average of 47 metro areas
The number of homes for sale in June 2026 was up 5.0% from May 2026 and up 2.5% from June 2025. Based on the rate of home sales in June 2026, the months' supply of inventory was 2.7, up from 2.5 in May 2026 and the same as June 2025. The markets with the highest and lowest months' supply of inventory were: