Lumber’s 24.5% Increase Leads Higher Building Material Costs
Originally Published by: NAHB — February 15, 2022
SBCA appreciates your input; please email us if you have any comments or corrections to this article.
The prices of goods used in residential construction ex-energy climbed 3.6% in January (not seasonally adjusted), according to the latest Producer Price Index (PPI) report released by the Bureau of Labor Statistics. The index was led higher by a 25.4% jump in softwood lumber prices and 9.0% price increases for indoor and outdoor paint.
Building materials prices increased 20.3%, year-over-year, and have risen 28.7% since January 2020. Over the past four months, the index has climbed 8.4%.

The price index of services inputs to residential construction increased 2.9% in January following a 1.3% increase in December 2021. The index declined 13.5% between June and November last year but has increased 4.1% in the two months since. The index is 8.9% higher than it was a year prior and 24.1% higher than the January 2020 reading.
Softwood Lumber
The PPI for softwood lumber (seasonally adjusted) increased 25.4% in January following 21.3% increase the month prior. Since reaching its most recent trough in September 2021, prices have increased 73.9%. According to Random Lengths data, the “mill price” of framing lumber has more than tripled since late August.

The PPI of most durable goods for a given month is largely based on prices paid for goods shipped, not ordered, in the survey month. This can result in lags relative to cash market prices and is why last month’s post indicated that “another sizable increase in the softwood lumber producer price index may be in the [January 2022] PPI report.”
Paint
The PPIs for both exterior as well as interior architectural coatings (i.e., paint) increased 9.0% in January. Year-over-year, the prices of exterior and interior paint have climbed 30.3% and 21.2%, respectively. Prior to 2021, the record 12-month price increase for exterior paint was 8.5% while that for interior paint was 10.1%–each of which was set in March 2019.
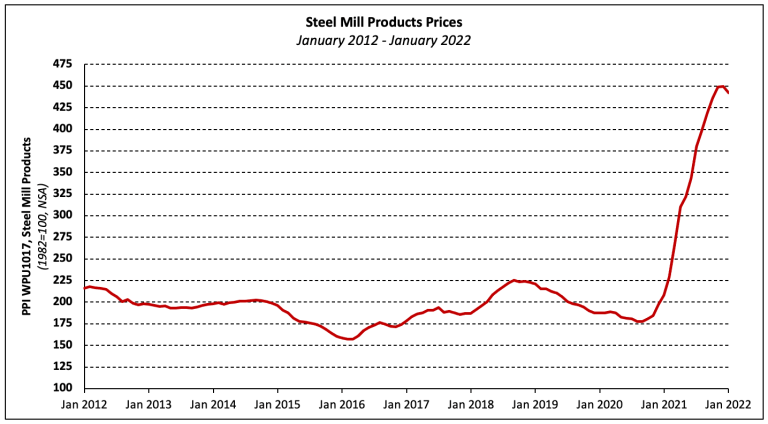
Steel Products
Steel mill products prices declined 1.9% in January, the first decrease in nearly a year and a half. Monthly increases in the PPI for steel mill products slowed in each of the five months preceding January 2022.

Even after the decline, however, prices have more than doubled over the past 12 months.
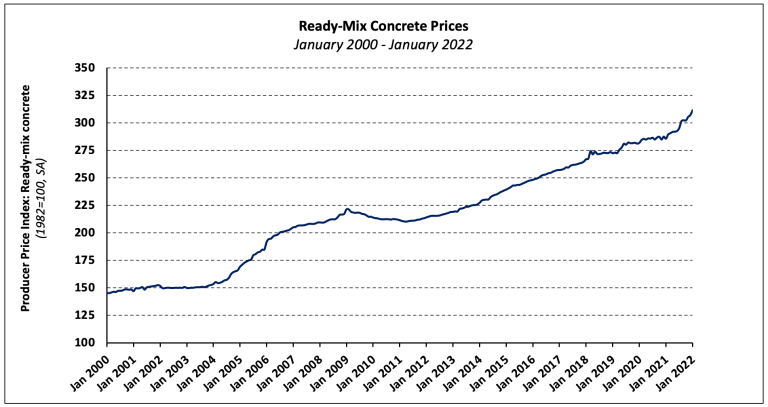
Ready-Mix Concrete
The PPI for ready-mix concrete (RMC) gained 1.4% in January after increasing 0.6% in December. The index for RMC increased has been relatively volatile since mid-2020 and has climbed 9.1%, year-over-year (YoY). Prior to January 2021, year-over-year price increases had not exceeded 8.0% since December 2006.
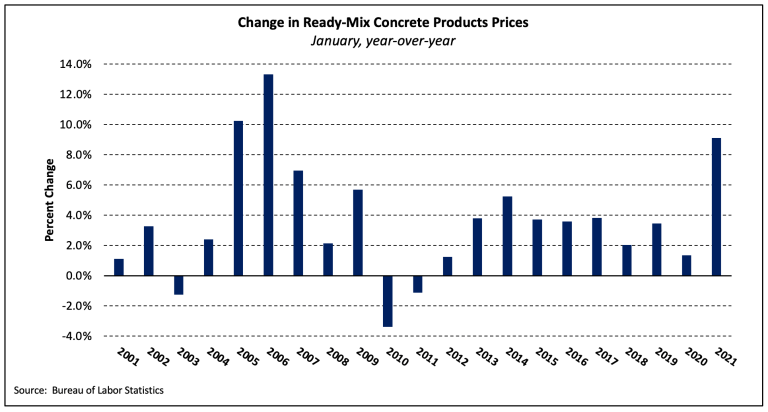
Prices have risen an average of 0.6% per month since January 2021—double the 20-year average but lower than the housing boom average (+0.8%).
At the regional level, prices increased in the Northeast (0.4%), Midwest (0.9%), South (1.7%) and West (4.4%). While RMC prices showed modest increases (year-over-year) in January 2021, the 12-month increases were significantly larger in January 2022 in each region except the Northeast.

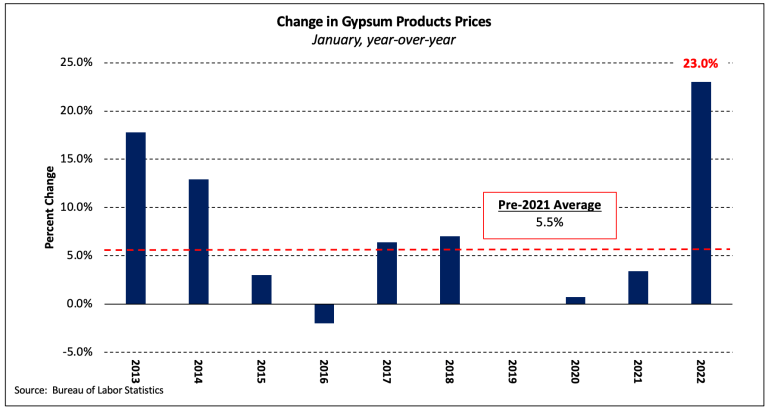
Gypsum Products
In January, the PPI for gypsum products climbed 3.4%–the 11th consecutive monthly increase. Gypsum prices have decreased just once since August 2020 and have risen 31.4% since then.

Gypsum products prices have gained 23.0%, year-over-year, the largest increase since data became available in 2012 and more than quadruple the 10-year average.
Other Building Materials
The chart below shows the changes in other price indices relevant to the residential construction industry since January 2020.
