Multifamily Developer Confidence Edges Higher in Q3
Originally Published by: NAHB — November 6, 2025
SBCA appreciates your input; please email us if you have any comments or corrections to this article.
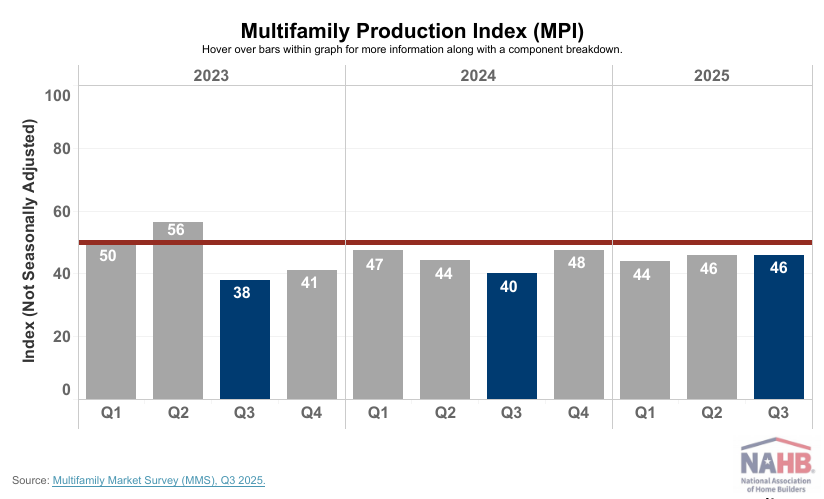
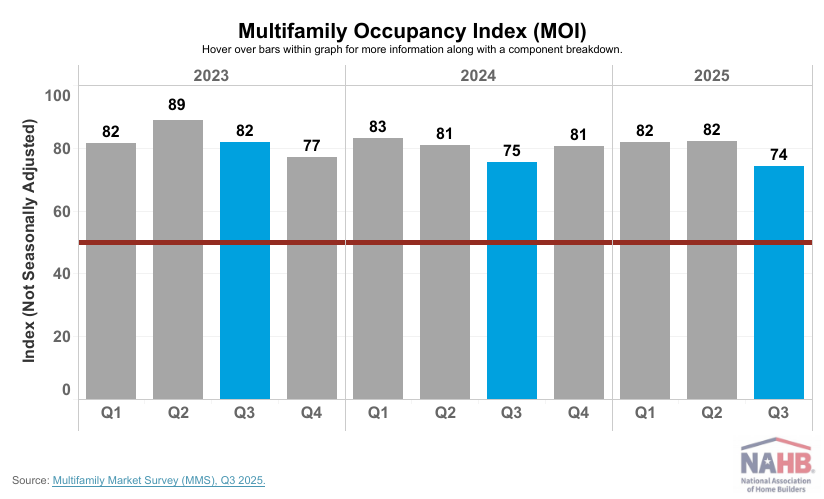
Confidence in the market for new multifamily housing increased year-over-year in the third quarter, according to the Multifamily Market Survey (MMS) released today by the National Association of Home Builders (NAHB). The MMS produces two separate indices. The Multifamily Production Index (MPI) had a reading of 46, up six points year-over-year, while the Multifamily Occupancy Index (MOI) had a reading of 74, down one point year-over-year.
The MPI and MOI are giving a mixed picture, creating a bifurcation of the multifamily market. While MPI is still in negative territory, developers of low-rise market-rate and subsidized rental properties express increased optimism, with both components above 50 for the quarter. Weakness is concentrated in the mid-to-high-rise and condominium developments which tend to be common in high-density metro areas. This is consistent with NAHB’s Home Building Geography Index where multifamily construction activity is growing in areas with low population densities but weakening in the larger metros.
Even though MOI is in positive territory and existing apartment owners are positive about occupancy overall, this is the lowest reading since NAHB redesigned the survey starting in Q1 2023. Sentiment for mid/high-rise apartment occupancy is noticeably weaker than it is for the other two rental market segments.
Multifamily Production Index (MPI)
The MMS asks multifamily developers to rate the current conditions as “good”, “fair”, or “poor” for multifamily starts in markets where they are active. The index and all its components are scaled so that a number above 50 indicates that more respondents report conditions as good rather than poor. The MPI is a weighted average of four key market segments: three in the built-for-rent market (garden/low-rise, mid/high-rise, and subsidized) and the built-for-sale (or condominium) market.
All four components experienced year-over-year increases in the third quarter of 2025: both the components measuring mid/high rise and subsidized units jumped up nine points to 37 and 55, respectively, the component measuring built-to-sale units increased six points to 35, and the component measuring garden/low-rise units increased three points to 51.
Multifamily Occupancy Index (MOI)
The survey also asks multifamily property owners to rate the current conditions for occupancy of existing rental apartments, in markets where they are active, as “good”, “fair”, or “poor”. Like the MPI, the MOI and all its components are scaled so that a number above 50 indicates more respondents report that occupancy is good than as poor. The MOI is a weighted average of three built-for-rent market segments (garden/low-rise, mid/high-rise and subsidized).
Two of the three MOI components experienced year-over-year decreases in the third quarter of 2025; the component measuring subsidized units fell by five points to 81 and the garden/low-rise component dipped one point to 76. Meanwhile, the component measuring mid/high-rise units was unchanged at 66. All three MOI components remain well above the break-even point of 50.
The MMS was re-designed in 2023 to produce results that are easier to interpret and consistent with the proven format of other NAHB industry sentiment surveys. Until there is enough data to seasonally adjust the series, changes in the MMS indices should only be evaluated on a year-over-year basis.
Please visit NAHB’s MMS web page for the full report.