See What Happened to Private Residential Spending in June
Originally Published by: NAHB — August 2, 2021
SBCA appreciates your input; please email us if you have any comments or corrections to this article.
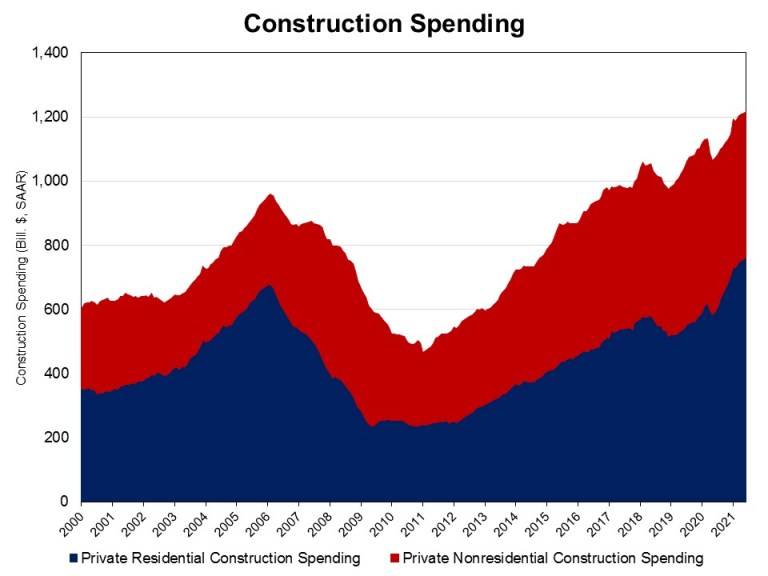
NAHB analysis of Census Construction Spending data shows that total private residential construction spending rose 1.1% in June to a seasonally adjusted annual rate of $763.4 billion. Total private residential construction spending was 29.3% higher than a year ago.
- ADVERTISEMENT -

The monthly gains are attributed to the strong growth of spending on single-family construction and improvements. Single-family construction spending rose to a $411.8 billion annual pace in June, up by 1% over the May estimates. It increased by 51.9% on a year-over-year basis. This is line with the steady readings of single-family housing starts. Spending on improvements edged up 0.4% in June, after a 0.6% dip in May. Multifamily construction spending slipped 0.1% to a $99.1 billion annual pace in June but was 19.7% higher than a year ago.
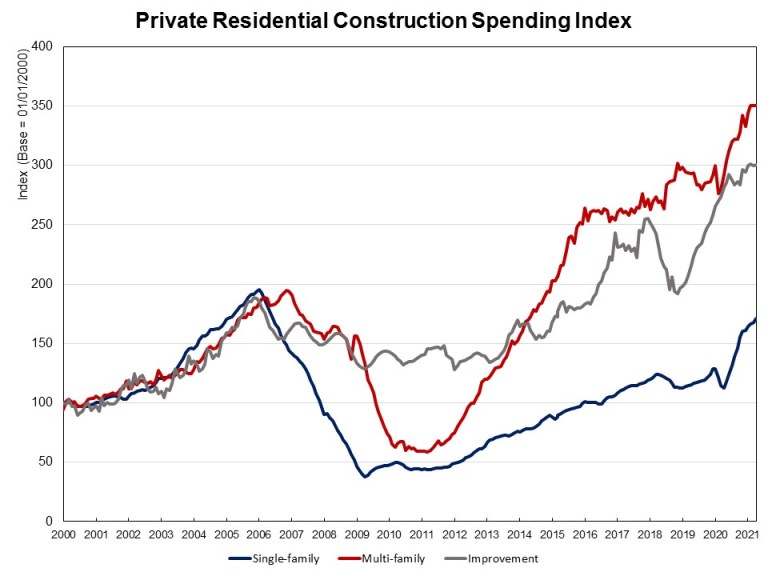
The NAHB construction spending index, which is shown in the graph below (the base is January 2000), illustrates the solid growth in single-family construction and home improvement from the second half of 2019 to February 2020, before the COVID-19 hit the U.S. economy, and the quick rebounds since July 2020. New multifamily construction spending has picked up the pace after a slowdown from the second half of 2019.
Private nonresidential construction spending decreased 0.7% to a seasonally adjusted annual rate of $451.8 billion in June. And it was 6% lower than a year ago. The largest contribution to this month-over-month nonresidential spending decrease was made by the class of power ($1.3 billion), followed by manufacturing ($0.8 billion), and amusement and recreation ($0.2 billion).