Charts: Low Density Markets Largely Unaffected by Slowdown
Originally Published by: NAHB — June 6, 2023
SBCA appreciates your input; please email us if you have any comments or corrections to this article.
While single-family home building has slowed significantly from pandemic-fueled highs because of higher interest rates and construction costs, the slowdown is less pronounced in lower density markets. On the other hand, multifamily market growth remained strong throughout much of the nation, according to the latest findings from the National Association of Home Builders (NAHB) Home Building Geography Index (HBGI) for the first quarter of 2023.
Across the single-family market, the 4-quarter moving average of the year-over-year growth rates have all fallen to negative levels from one year ago. The largest decrease in the growth rate was in Large Metro – Outlying Counites which fell from 17.4% in the first quarter of 2022 to -22.3% in the first quarter of 2023. All markets had a negative growth rate in the first quarter of 2023 with Micro Counties being the highest at -2.9% and Large Metro – Core Counties having the lowest rate at -25.6%.

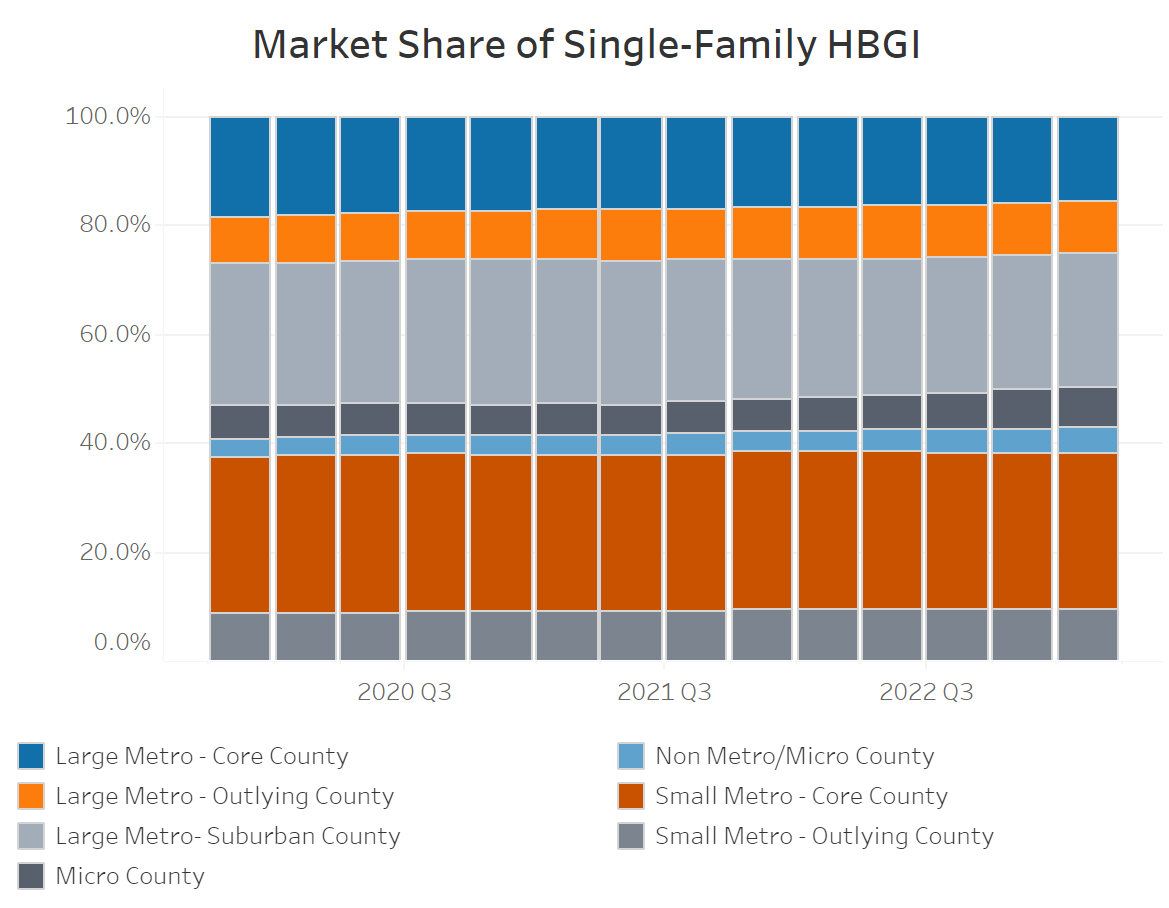
Over the past four years rural markets have exhibited particular strength. The rural (Micro Counties and Non Metro/Micro Counties) single-family home building market share has increased from 9.4% at the end of 2019 to 12.0% by the first quarter of 2023. The largest decrease in single-family market share between the end of 2019 and the first quarter of 2023 was in Large Metro – Core Counties, which fell 2.7 percentage points from 18.4% to 15.7%. The combined Large Metro areas (Core, Suburban and Outlying) market share has fallen for seven consecutive quarters to a share of 49.7%. This is the first time the combined Large Metro market share has fallen below 50.0% market share since the inception of the HBGI.
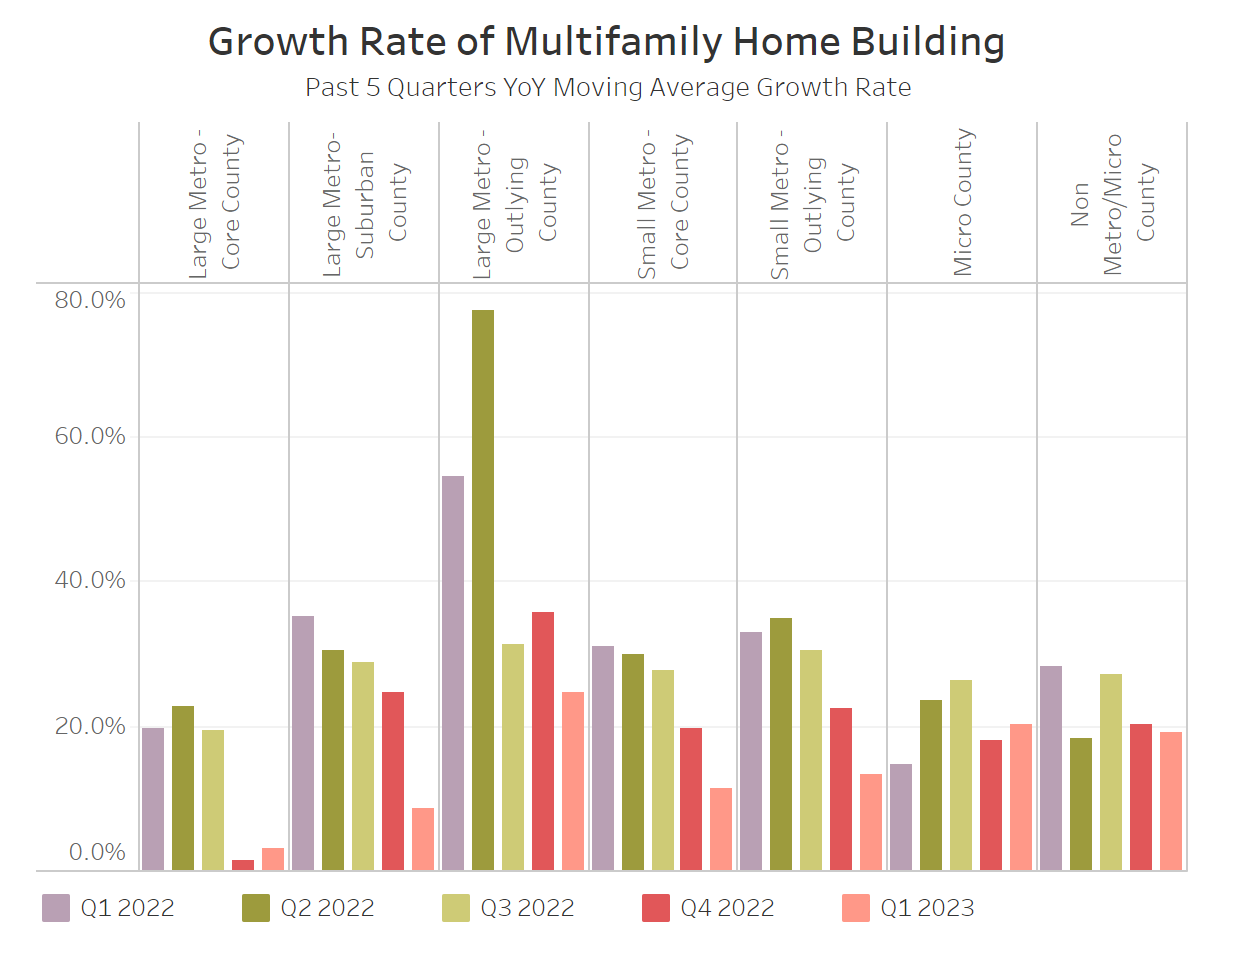
Meanwhile, the multifamily construction market remains strong with all HBGI markets having positive growth rates in the first quarter of 2023. Large Metro – Core Counties had the lowest multifamily growth rate at 3.2%, up from 1.5% from the fourth quarter of 2022. For the 7th consecutive quarter, Large Metro – Outlying Counties had the highest growth rate at 24.5%.
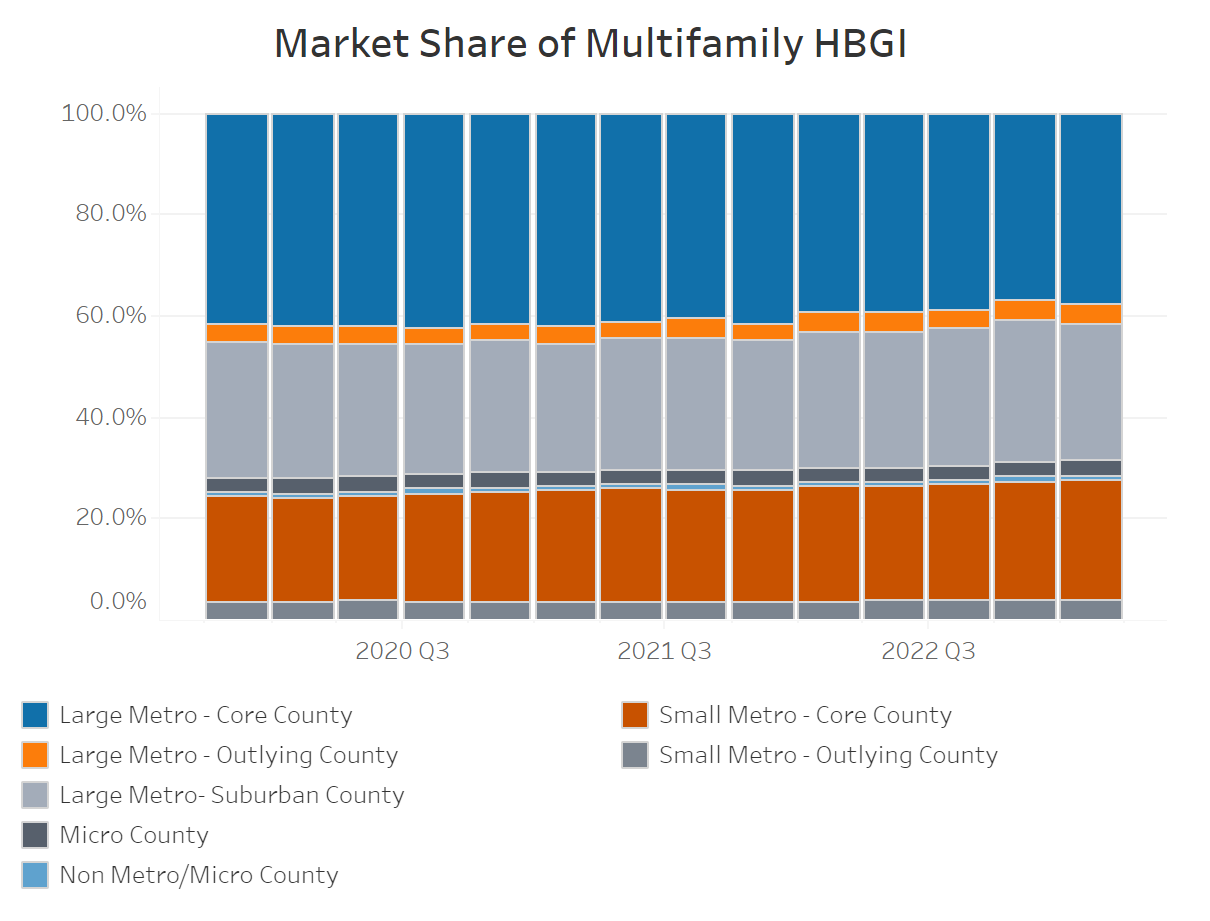
The multifamily market share for Large Metro – Core Counites increased in the first quarter of 2023 after losing market share for all of 2022, now standing at 37.5%. Since the first quarter of 2020, Small Metro – Core Counties market share has increased 3.0 percentage points from 20.6% to 23.6%. This was the largest increase between the first quarter of 2020 and 2023 for any of the HBGI markets. Over the same period, the largest decrease in market share was in Large Metro – Core Counties which fell 4.7 percentage points.
The first quarter of 2023 HBGI data can be found at https://nahb.org/hbgi.