Zonda Indicates Housing Market Finding Strength
Originally Published by: Zonda — March 21, 2023
SBCA appreciates your input; please email us if you have any comments or corrections to this article.
 The spring selling season started with a bang. Many consumers on the sidelines have been enticed back to the market by deals provided by homebuilders. Others have come to terms with the state of the market and the idea that 3% mortgage rates are a thing of the past.
Zonda’s new home sales metric captures this, with activity up 2.2% month-over-month in February following a strong January. Some of the hardest-hit markets in the western U.S. are showing notable improvements, while sales in the east range from stable to strong.
 “Housing demand showed real-time sensitivity to mortgage rates as they rose throughout February, with many builders reporting stronger demand in the former part of the month compared to the latter,” said Ali Wolf, chief economist for Zonda. “The collapse of Silicon Valley Bank and Signature Bank sent mortgage rates back down, though, as investors piled money into government bonds. The new question is – will consumers continue to celebrate the downward move in mortgage rates, or will broader economic concerns push them back to the sidelines?”
Sales activity continued the upward trend in February
Zonda’s new home sales metric counts the number of new home contract sales each month and accounts for both cancellations and seasonality. This metric shows there were 626,627 new homes sold in February on a seasonally adjusted annualized rate. This was a gain of 2.2% from last month and a drop of 18.3% from a year ago. On a non-seasonally adjusted basis, 52,698 homes were sold, 18.6% lower than last year and 9.3% above the same month in 2019.

A strong start to the spring selling season
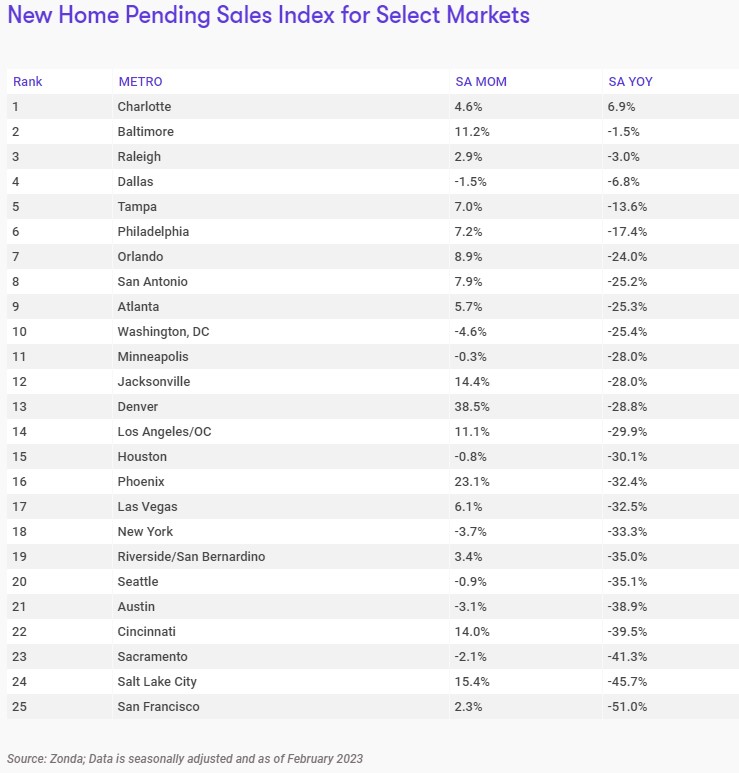
Total sales volume is influenced by both supply and demand. Zonda’s New Home Pending Sales Index (PSI) was created to help account for fluctuations in supply by combining both total sales volume with the average sales rate per month per community. The February PSI came in at 117.7, representing a 24.9% decline from the same month last year but up 4.6% compared to last month. The index is currently 32.4% below cycle highs.
 View interactive map
- The only market that grew relative to last year was Charlotte (+6.9%).
- The metros that performed the worst year-over-year were San Francisco (-51.0%), Salt Lake City (-45.7%), and Sacramento (-41.3%).
- On a monthly basis, some of the markets that were hit the hardest the earliest last year, Denver, Phoenix, and Salt Lake City, were the best performing in February. Denver increased 38.5% relative to last month.
Home prices are up YOY but at a decelerated pace
National home prices increased year-over-year across entry-level, move-up, and high-end homes. Prices rose 7.0% for entry-level to $336,364, 7.1% for move-up to $527,226, and 7.8% for high-end homes to $909,644.
Supplementing our data with a monthly survey Zonda conducts, the majority of builders reported holding their prices flat month-over-month from January to February. Roughly 22% of builders lowered prices and 22% increased them.

Incentives are still common in today’s housing market given the lower levels of sales. 57.8% of active projects are offering to-be-built incentives, up slightly from last month. The average incentive dollar amount is $13,258 or 2.6% of the list price.
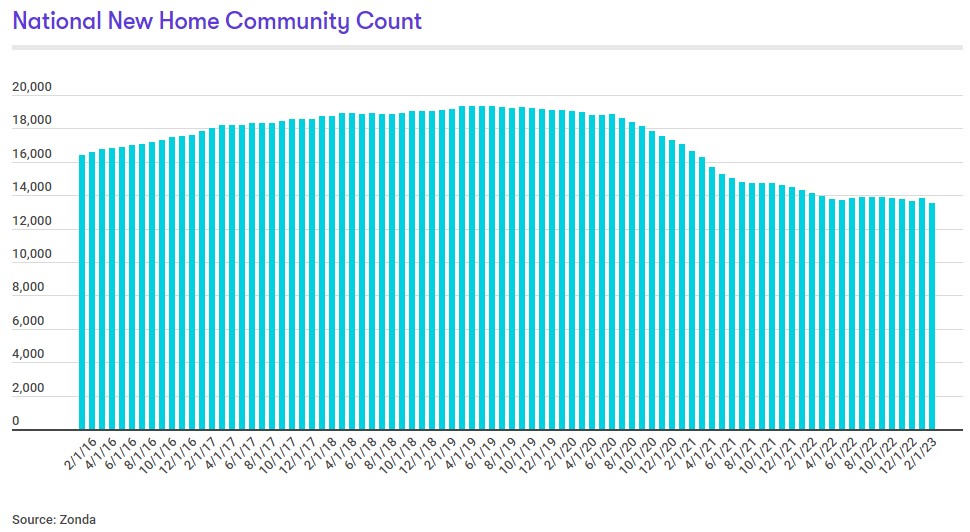
Total community count has yet to find bottom
There are currently 13,559 actively selling communities tracked by Zonda, down 4.1% from last year. On a month-over-month basis, the national figure slipped 2.0%. Total community count is 29.3% below the same month in 2019. Zonda defines a community as anywhere where five or more units are for sale.
- Riverside/San Bernardino (+19.7%), Phoenix (+10.4%), and Los Angeles/OC (+10.0%) grew community count the most year-over-year.
- Relative to last year, the biggest community count declines were seen in Baltimore (-20.9%), New York (-18.8%), and Atlanta (-16.9%).
- Community count in none of our select markets rose month-over-month, 4% were flat, and 96% fell.
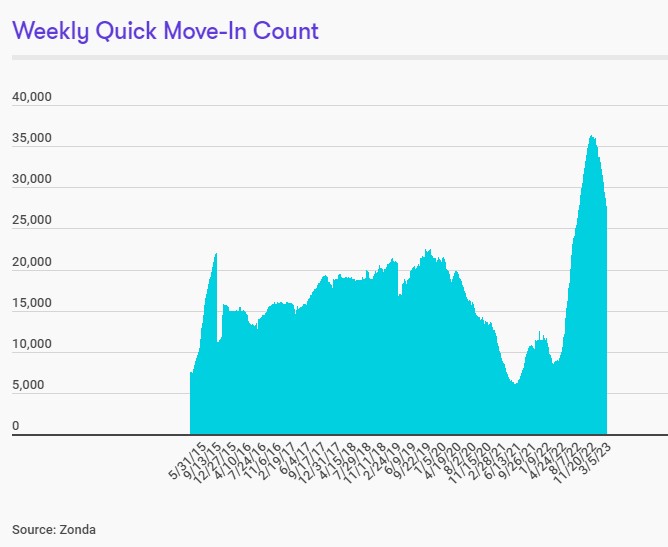
National quick move-ins (QMIs) totaled 27,752, up 225.6% compared to last year but 13.9% lower month-over-month. Total QMIs are 40.4% above 2019 levels. QMIs are homes that can likely be occupied within 90 days.
In many cases, builders have been willing and able to offer more aggressive price cuts and/or incentives to help sell QMIs over the past few months, and the month-over-month drop captures the effectiveness. Further, QMIs have been preferred by some consumers looking to move now as inventory on the resale market remains constrained.
Zonda’s survey of builders in February found that nearly 60% were either somewhat comfortable or comfortable with their QMI levels, while the balance were somewhat uncomfortable or uncomfortable.
- On a metro basis, all of Zonda’s select markets increased QMI count year-over-year.
- The markets posting the biggest gains year-over-year were Phoenix, Tampa, and Raleigh. All three markets have seen QMIs rise 600%+ YOY. While the percent is high, it’s important to understand where the QMIs are within the market and at what price point. Matching the national trend, month-over-month QMIs were 4% lower in Phoenix, 24% in Tampa, and 21% in Raleigh.
- Jacksonville, Phoenix, and Sacramento have seen the most growth in QMIs compared to the same time in 2019, up 363.3%, 203.3%, and 169.8%, respectively.
Methodology
The Zonda New Home Pending Sales Index (PSI) is built on proprietary, industry-leading data that covers 60% of the production new home market across the United States. The reported number of new home pending contracts are gathered and analyzed each month. Released on the 15th business day of each month, the New Home PSI is a leading indicator of housing demand compared to closings because it is based on the number of signed contracts at a new home community. Zonda monitors 18,000 active communities in the country and the homes tracked can be in any stage of construction.
The new home market represents roughly 10% of all transactions, allowing little movements in supply to cause outsized swings in market activity. As a result, the New Home PSI blends the cumulative sales of activity recently sold out projects with the average sales rate per community, which adjusts for fluctuations in supply. Furthermore, the New Home PSI is seasonally adjusted based on each markets’ specific seasonality, removes outliers, and uses June 2016 as the base month. The foundation of the index is a monthly survey conducted by Zonda. It is necessary to monitor both new and existing home sales to establish an accurate picture of the relative health of the residential real estate market.