Brooks Outlines Why Logistics are Also Hampering Housing
Originally Published by: LBM Executive by Greg Brooks — May 20, 2021
SBCA appreciates your input; please email us if you have any comments or corrections to this article.
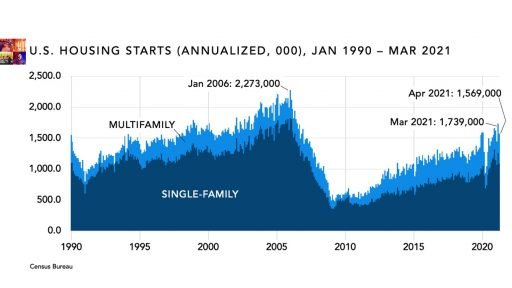
More April showers in the housing market. Starts and permits are out and both the U.S. and Canada are down for the month. Total U.S. starts fell 9.5% to 1.57 million annualized. Single-family starts were 1.09 million, down 13.4%, while multifamily came in at 482,000, up 0.8% from March.
In Canada, total starts fell 16.9% to 251,504 annualized—although it’s worth noting that March’s 302,663 starts were an all-time record high. Single-family detached starts were flat: 78,918 vs. 78,971 in March. Multiples nosedived, falling 22.8% to 172,586 annualized.
- ADVERTISEMENT -

Year-over-year comparisons are pretty much worthless this month. The numbers are all skewed because April 2020 was the month the pandemic shut the economy down.
Versus April 2019, the U.S. is clearly making progress: Total starts rose 22.4%. Multifamily was up 19.9% while single-family starts were up 23.5%. Meanwhile, the Canadian market is as hot as it’s been in over 30 years.
The remarkable thing is that this is happening despite the fact that home prices are at all-time highs in both countries. So are lumber and panel prices, of course—and if it hasn’t happened already, steel, copper, aluminum, and plastic are close behind.
The reasons are no mystery. Lumber producers got caught flatfooted when COVID hit and the housing market didn’t crash. Others are struggling to rebuild capacity now that consumers are ready to spend money again.
- ADVERTISEMENT -

And absolutely everyone is struggling to move stuff from point A to point B. From rail to trucking to air, maritime, donkeys, whatever—you name it and the logistics network is…well, FUBAR is the technical term.
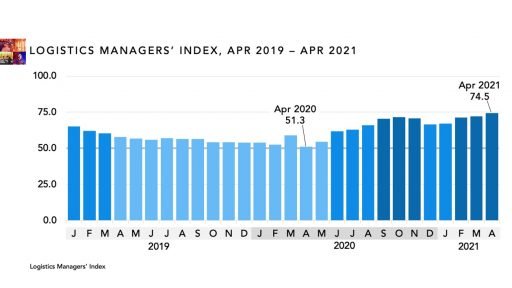
The Logistics Managers’ Index (LMI) is a monthly survey developed by a group of supply chain management professors. It tracks eight key indicators of logistics activity vs. capacity: inventory levels, transportation and warehousing utilization, and prices. Anything over 50 indicates that logistics activity is outpacing the growth of capacity; anything below 50 indicates slack in the channel.
In April the LMI came in at 74.5, “the second-highest reading in the history of the index,” says Zac Rogers, an assistant professor at Colorado State University who helped develop the index.
Everyone knows pent-up demand is exploding. Rogers says there’s more to it than that. “At the same time, consumers are continuing to rely heavily on methods of shopping they grew accustomed to during lockdown, such as at-home delivery or pickup from store. These channels of consumption tend to require a greater number of trucks and more expansive warehouse networks than more traditional alternatives.”
Transportation capacity began to contract when the pandemic hit, and LMI’s data say it is still contracting, albeit at a slower rate. Inventory costs, warehouse prices, and transportation prices are all at record-high levels and still rising.
Says Rogers, “the combination of increasing demand and increasingly restricted supply will likely continue to be an issue going forward.” LMI survey respondents “have been faced with steep rates of price growth since last summer, and at this point they do not seem hopeful that there will be much relief over the next year.”
Buckle up. The excitement isn’t over yet by a long shot.