Chart: Private Residential Construction Spending Cools
Originally Published by: Eye on Housing — December 1, 2021
SBCA appreciates your input; please email us if you have any comments or corrections to this article.
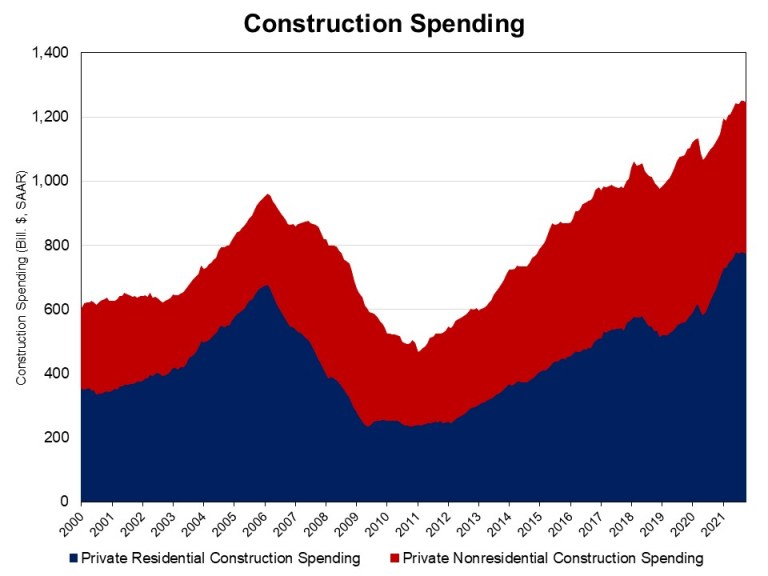
NAHB analysis of Census Construction Spending data shows that total private residential construction spending stood at a seasonally adjusted annual rate of $774.9 billion, down 0.5% from the upwardly revised September estimates. Total private residential construction spending was 16.7% higher than a year ago.
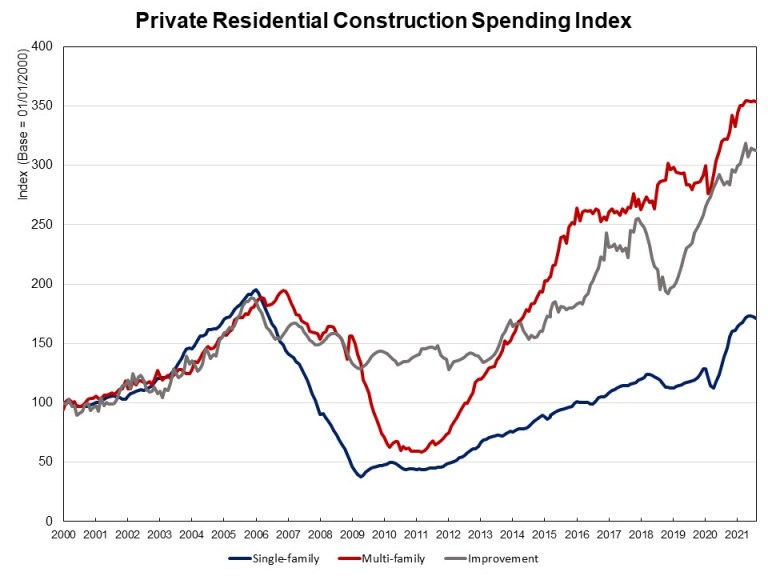
Spending on single-family, multifamily constructions and improvements all declined in October, as homebuilding is still facing the supply chain issues, the rising material costs and labor shortages. Single-family construction spending decreased to a $412.1 billion annual pace in October. It was down by 0.8% after a dip of 0.2% in September and down 0.3% in August. Multifamily construction spending dipped 0.1% in October. Compared to a year ago, single-family construction spending was up 23.1% and multifamily spending increased 9.9%. Spending on improvements dipped 0.2% in October, after a decrease of 0.5% in September. However, improvement spending is 10.2% higher than a year ago.
The NAHB construction spending index, which is shown in the graph below (the base is January 2000), illustrates the solid growth in single-family construction and home improvement from the second half of 2019 to February 2020, before the COVID-19 hit the U.S. economy, and the quick rebounds since July 2020. New multifamily construction spending has picked up the pace after a slowdown in the second half of 2019. Under the pressure of supply chain issues, construction spending on single-family, multifamily and improvements slipped down a bit from the third quarter of 2021.
Private nonresidential construction spending increased to a seasonally adjusted annual rate of $470.3 billion in October, a 0.2% increase from upwardly revised September estimates. And it was 3.1% higher than a year ago. The largest contribution to this month-over-month nonresidential spending increase was made by the class of commercial ($9.9 billion), followed by manufacturing ($2.9 billion), and class of health care ($1.4 billion).