Measuring What Matters
Using Data to Empower, Improve Output, and Foster Growth
By Tony Acampa
In today’s data-driven landscape, managing a design team effectively requires more than just experience and gut instinct. It involves using clear, measurable data to make informed decisions, optimize resources, and take corrective action when needed. Data gives managers a clearer view of productivity, collaboration, individual performance, and team health: key components to unlocking a design team’s full potential.
You’ve likely heard the phrase, “You can’t manage what you don’t measure.” While true, data however shouldn’t dominate your management style. Instead, it should provide an objective lens to understand how your team functions. Without it, decisions often rely on assumptions or anecdotes, leading to inefficiencies and missed opportunities.
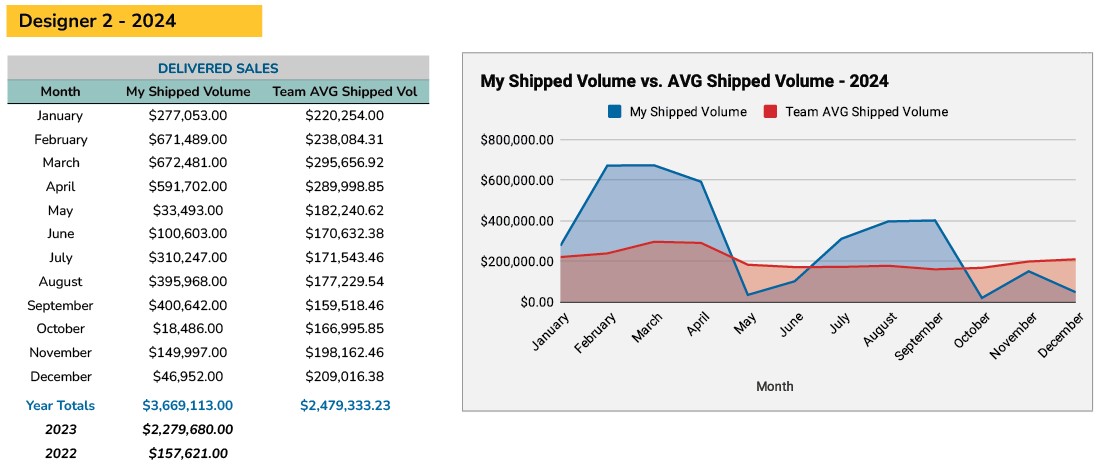
Fig. 1
When I took on the role of Design Manager at Shelter Systems, one of my first priorities was addressing productivity across the design team, specifically among our truss technicians. I noticed a significant gap in individual output, which suggested we had untapped capacity.
There are multiple ways to measure output: board feet, square feet, linear feet, or dollars. I chose to track output in dollars for its simplicity and incorporated percentage-based metrics to fairly evaluate each team member’s contribution. This helped ensure accountability and alignment across the team.
While many project management tools exist today, back in 2015 I developed a custom tool to track this information (See Fig. 1). Designers can view their shipped dollar volume each month and compare it with the team average. The dashboard also shows output growth year-over-year, which adds valuable context. Visual elements, like graphs, make trends easy to interpret and provide a snapshot of performance fluctuations. These visuals help identify performance drivers like error rates and quoting volume, both of which we also track.
By using percentage-based data (See Fig. 2), we ensure balanced workloads across the team. This helps prevent burnout and reduce mistakes, and ultimately creates a happier, more productive team.
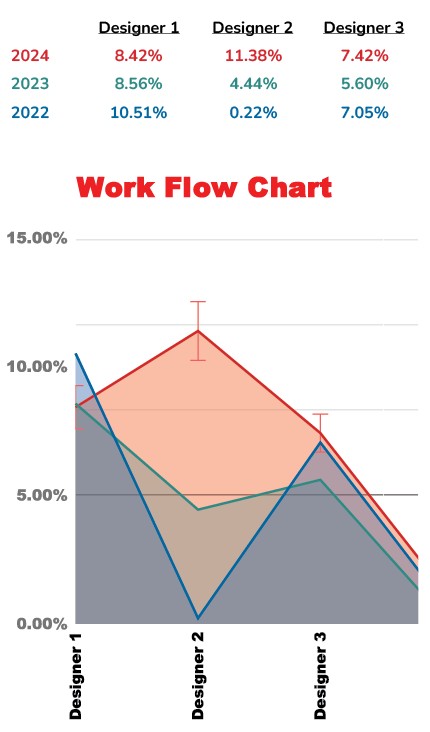
Fig. 2
Yes, we track mistakes, and yes, everyone makes them. What matters is how we respond to them. For each design error, we record the associated cost (including back charges) and compare it against each technician’s total shipped volume. This gives us a mistake-to-output percentage (See Fig. 3).
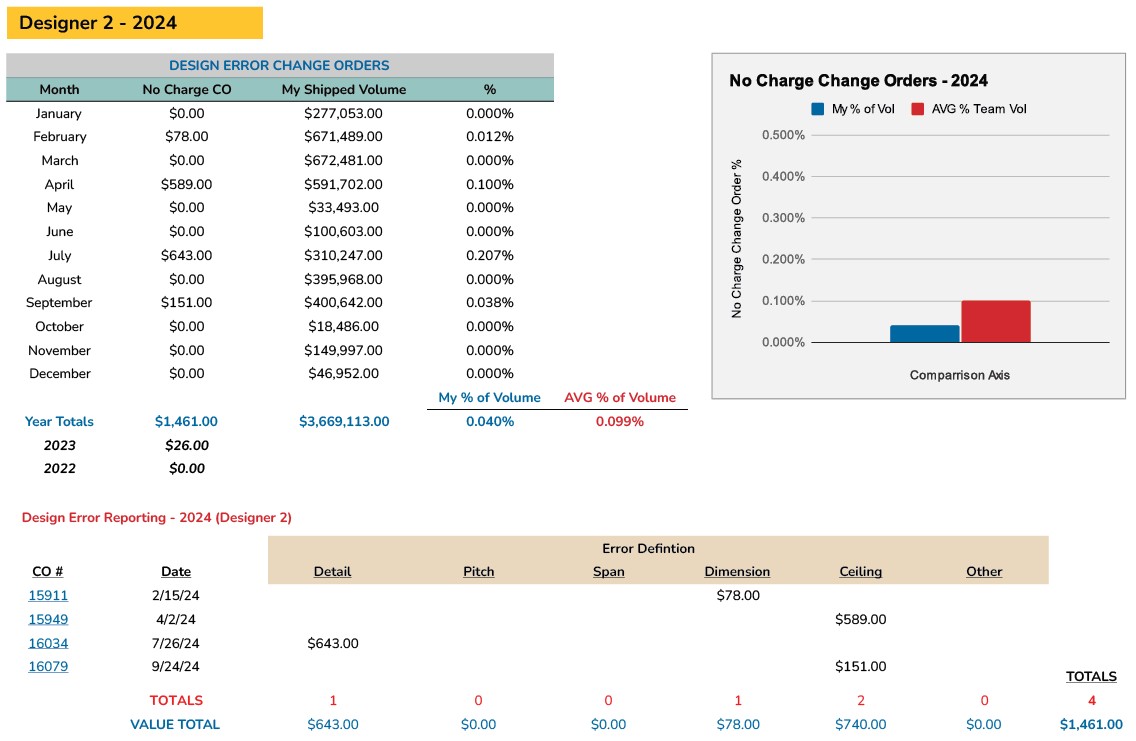
Fig. 3
We present this data visually using bar graphs, which help each technician understand how they compare with the rest of the team. But we don’t stop at the numbers. Every mistake is categorized and defined, allowing us to spot trends and systemic issues. If similar errors keep recurring, either across the team or from a specific individual, we take corrective action—whether it’s coaching, process changes, or training (See Fig. 4 & 5).
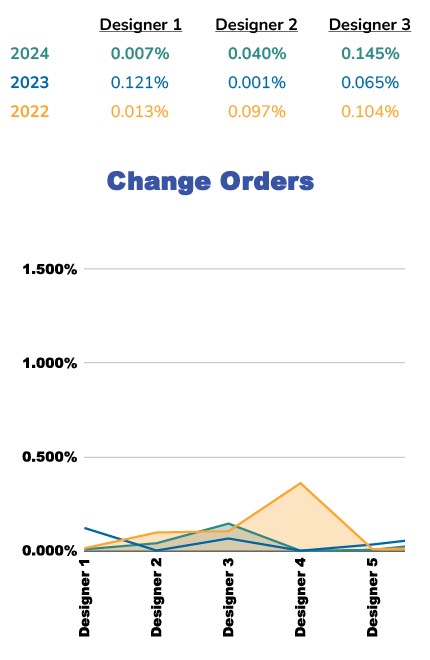
Fig. 4
This data-driven feedback also feeds into our team goals. By identifying common types of errors, we can work collectively to reduce them. It opens the door to team discussions, which help us stay aligned and improve together.
It’s important to stress that data should support your team, not control it. Transparency is key; before collecting and sharing any data, I make sure the team understands what we’re tracking, why it matters, and how it will be used. This builds trust and promotes buy-in.
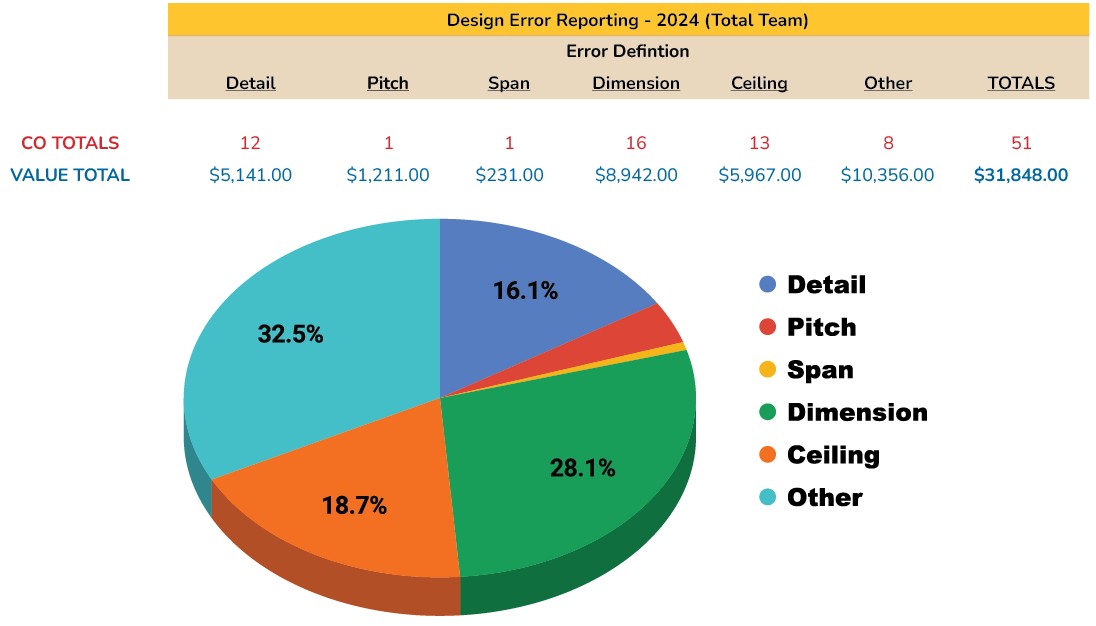
Fig. 5
Once the data is collected, the real value comes in how it’s used, particularly during performance reviews.
Reviews are vital to effective team management. When done right, they’re more than a formality, they’re structured, personalized conversations that encourage reflection, are a time to set goals, and promote growth.
We moved away from the old numeric self-evaluation format, which often felt impersonal and vague. Instead, we built a process centered on thoughtful questions designed to foster real dialogue. These conversations provide space to celebrate wins, acknowledge challenges, and plan for improvement.
The performance data we collect throughout the year plays a key role in these discussions. For example, if someone’s output is lagging, we’ll develop a strategy to improve it. If error rates are high, we identify what support or training might help. The goal is always improvement, not punishment.
But the reviews aren’t just about performance—they’re also deeply personal. We discuss things like family, hobbies, and external stressors that may affect work. It’s important to me that everyone on the team feels supported, both professionally and personally.
Each review begins with two foundational questions:
- Do you love what you do?
- Do you have any issues with anyone you work with?
These openers set the tone for a transparent, honest conversation and help reinforce a healthy team culture.
We divide our reviews into three key sections:
- Self-Evaluation
Team members reflect on their accomplishments, strengths, and challenges over the past year. We also explore which parts of their work they find fulfilling, and which areas may feel stagnant. If someone feels unchallenged, we look for ways to re-engage them, such as new responsibilities or learning opportunities. - Growth and Development
This is where we dive into their goals, both professional and personal. We ask about skills they’d like to develop and how we can help them succeed. It’s also a chance to reflect on the goals we set the previous year and whether we met them. We ask if they feel their strengths are being fully utilized and if there are ways we could adjust the team structure to better showcase their abilities. - Manager Feedback
This section flips the script—I ask for feedback on my own performance as a manager. I want to know what I’m doing that’s helpful, where I can improve, and how the team would describe our culture. One of my favorite questions is, “If you could change one thing about our department, what would it be, and how would you do it?” Over the years, the answers have helped shape the team’s direction in meaningful ways.
In summary, annual reviews and performance data aren’t about reducing people to numbers; they’re about using insights to foster growth, support, and continuous improvement. When managers approach these tools with transparency and intention, they build stronger, more engaged, and higher-performing teams.
Managing with data isn’t about micromanaging. It’s about leading with clarity, creating accountability, and empowering your team to thrive. When used thoughtfully, performance metrics become a powerful ally in building a supportive, efficient, and motivated design team.