Where Home Prices are Likely to Go This Year
Originally Published by: Builder — May 23, 2023
SBCA appreciates your input; please email us if you have any comments or corrections to this article.
“Where are prices going?” is a perennial question in the housing industry—one that has garnered even more attention recently given the volatility in the housing market over the past 12 months.
Heading into 2023, Fortune polled 18 top economists and housing experts across the country asking about expectations for where home prices might go this year (see graph below). There was a great divergence of opinions with some forecasters calling for price increases (up over 5%) and others expecting declines of 20%.
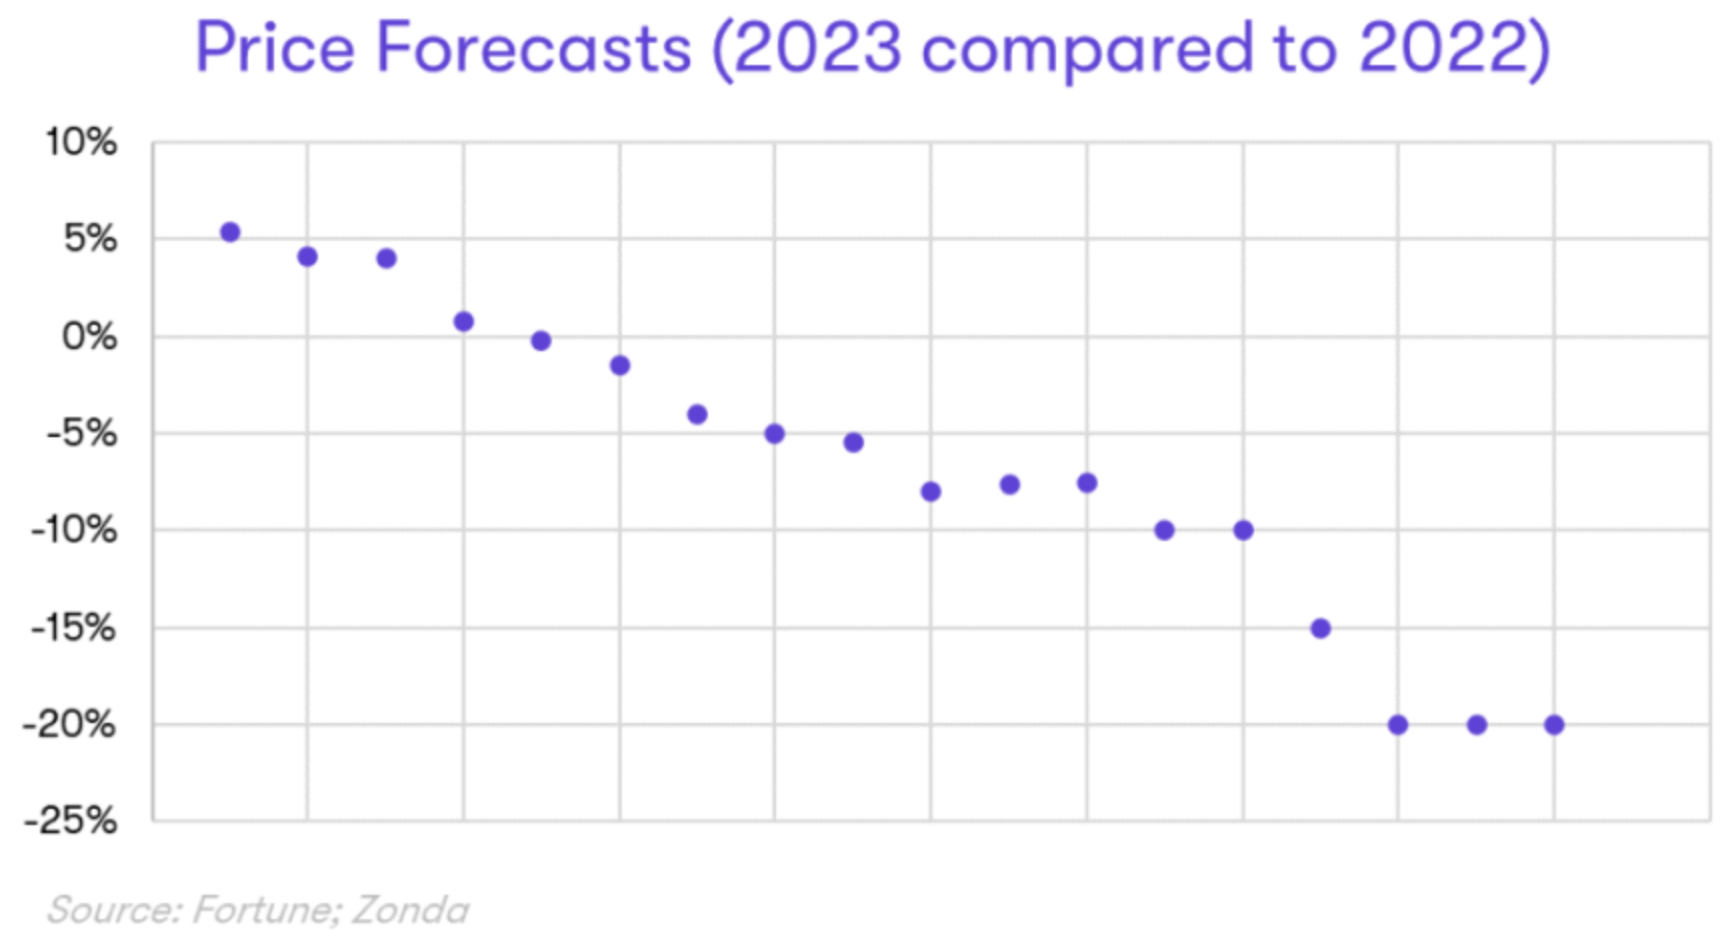
For context, it would take a nearly 30% decline in new-home prices and a 32% decline in existing-home prices to get them back to where they were going into the pandemic.
Pricing stats in early 2023 show a mixed message on a national level:
- Zonda data for April showed list prices up year on year (YOY) in entry-level, move-up, and high-end tiers, +3.5%, +3.5%, and +6.9%, respectively;
- Zillow’s Home Value Index increased 5% YOY as of March;
- The Case-Shiller National Home Price Index rose 2% YOY in February, the most recent data available;
- The April data from the National Association of Realtors showed existing single-family prices were down 2.1% YOY; and
- The U.S. Census Bureau captured an 8.2% drop in median new-home prices compared with the same month of last year.
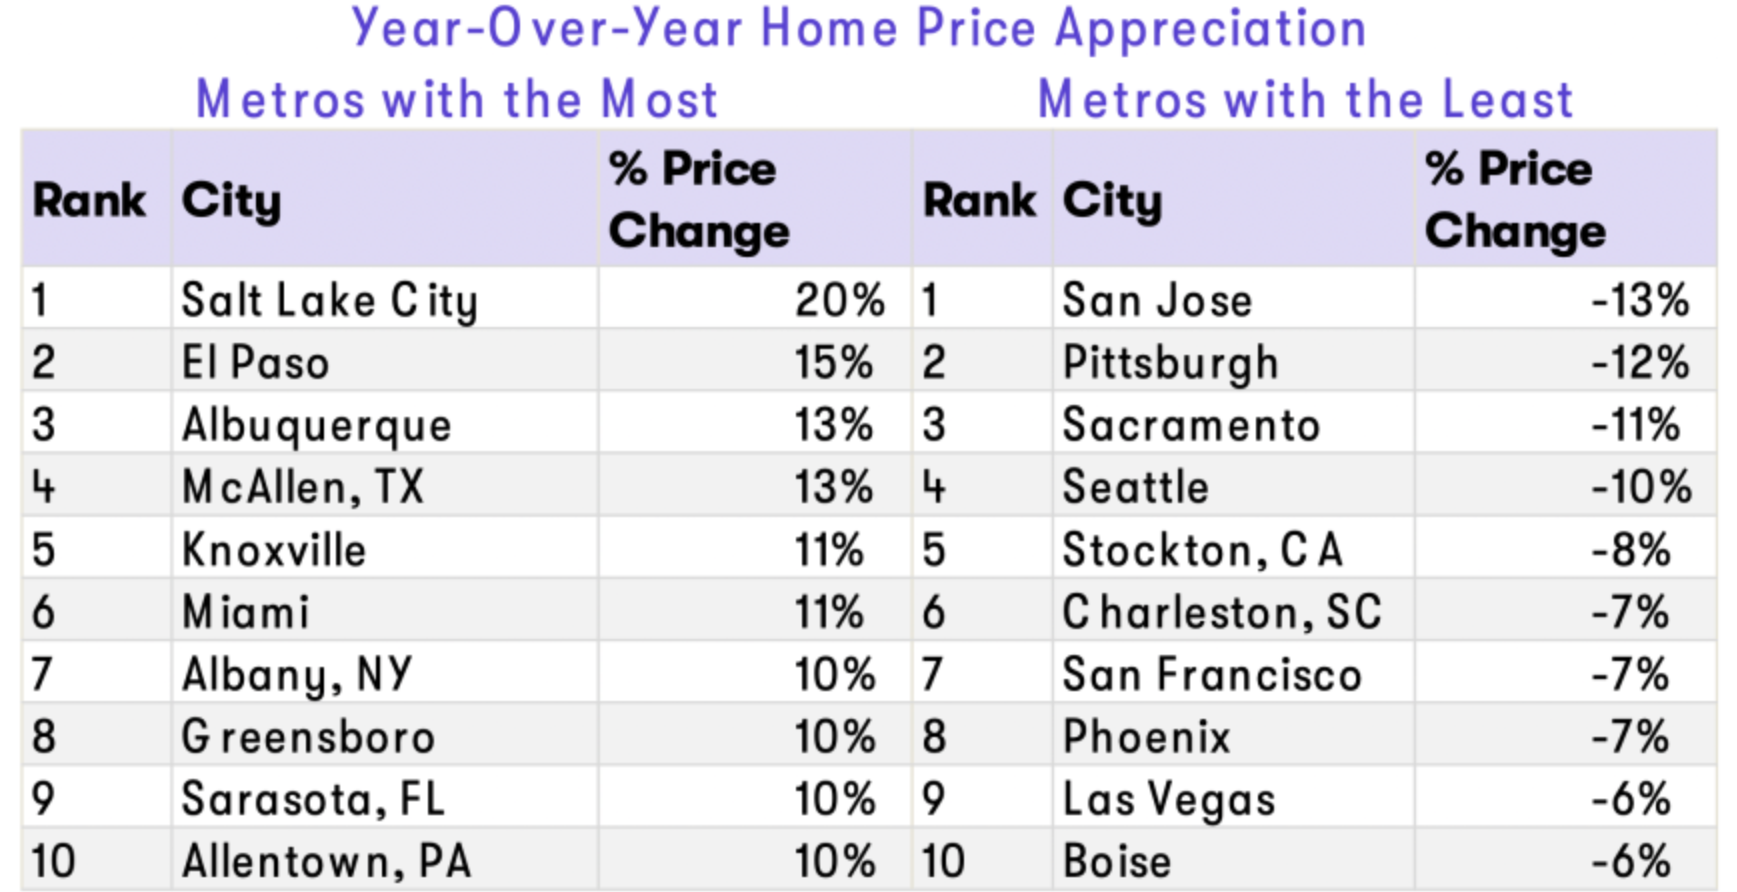
Looking by market, the wide variety of outcomes is also apparent, with some areas that have posted double-digit price appreciation while others have dropped down double-digits compared with last year.
With this backdrop in mind, we created a list of notable factors that might put upward or downward pressure on prices later this year and into next.
Upward Pricing Pressure Considerations
The lock-in effect. It is well understood at this point that 90% of homeowners have a mortgage rate under 5%. This has contributed to the so-called lock-in effect, where existing homeowners are unable or unwilling to sell their home and move because they don’t want to reset their fixed-rate mortgage.
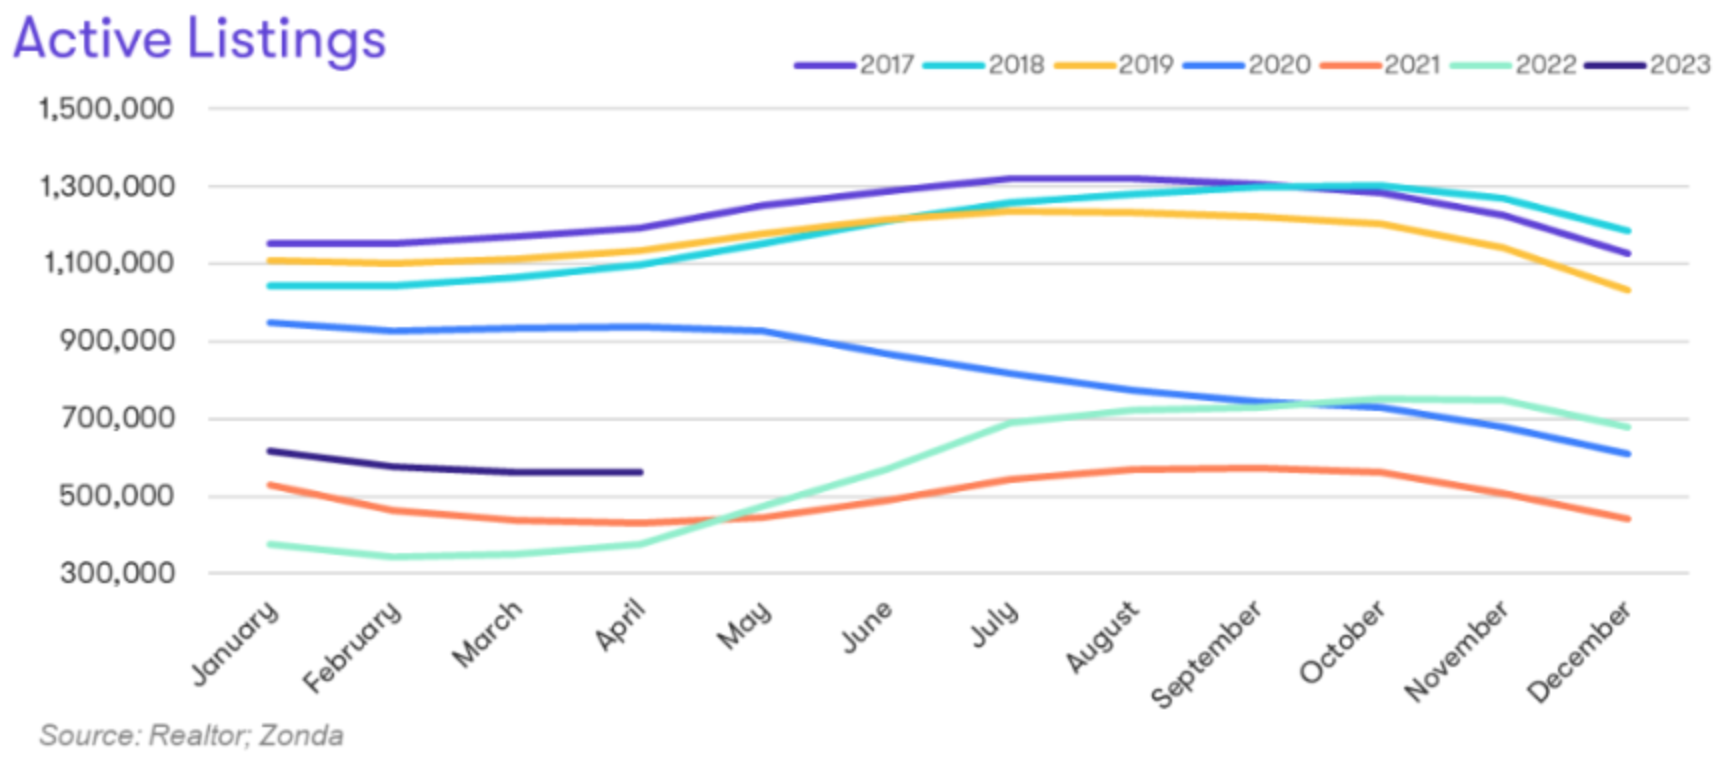
The lock-in effect is one of the reasons active listings are 39% below pre-pandemic levels. While the buyer pool is down given housing affordability constraints, overall supply is low enough that the supply/demand imbalance experienced over the past few years is persisting. As a result, the lack of inventory has allowed for continued upward pressure on home prices.
Systemic shortage. The systemic undersupply of housing is another consideration. As with price forecasts, estimates for the housing supply shortage vary widely, ranging from no undersupply to 7.3 million units undersupplied. Firms focused on the new-home construction industry have more conservative numbers, with both the NAHB and Zonda estimating the shortage at less than 2 million. Still, the longer-term undersupply of the market is theoretically supportive of upward pricing pressure.
High employment levels. The U.S. labor market has 2% more jobs compared with pre-pandemic levels and 6% more high-income jobs. The unemployment rate is at a 50-year low with the prime age labor force participation rate fully recovered from the pandemic. The strong labor market is supportive of home price growth by helping to fuel the demand pool.
A longing to own. Most of those renting want to own a home one day, with a large share of potential buyers stemming from millennials and Gen Z. The sheer volume of these prospective buyers outnumbers total supply for now, which is another force of upward pressure.
Downward Pricing Pressure Considerations
Recession and accompanying change in employment levels. A recent Wall Street Journal survey of economists showed a 60% probability that the U.S. is in a recession in the next 12 months. Put simply, a recession is an economic slowdown spread across multiple sectors lasting more than a few months. Recessions typically mean job losses, a counterpoint to the strength in the current labor market discussed above.
Home prices don’t always fall in recessions, but they sometimes do. If there is a notable uptick in unemployment, that could have ripple effects on total inventory, consumer confidence, and housing affordability.
In fact, contrary to popular belief, home prices do not typically lead an uptick in the unemployment rate. Rather, history tells us that you’ll see a rise in the unemployment rate around the same time that you’ll see home prices go down, though, as mentioned, a correction is not guaranteed.
Inventory increases. The expectation is that it will be difficult to have a true shock to the system by seeing a flood of listings hit the market. This is especially true when you look at the differences of today relative to the previous cycle. Exceptionally qualified home buyers with skin in the game via large downpayments represented the lion’s share of the buyer pool over the past few years, which should limit any kind of supply shock.
With that being said, we know builders are starting more homes, which can help address the shortage. Further, it is unlikely that the market will operate with today’s levels of inventory indefinitely, especially in the face of a recession.
Investors looking to offload some homes and people realizing they can’t afford their monthly payment because of a job loss, cut to income, or a resetting of an adjustable-rate mortgage could contribute to rising inventory and some downward pressure on pricing.
Affordability shock. The combination of rapid home price appreciation, mortgage rates at the highest level since 2008, and 5% inflation have stretched the budgets of many Americans. While there is a pool of more inelastic buyers, total demand is smaller than just a year ago. As we saw in in the fourth quarter of 2022, there is a reasonable path to the market temporarily having more supply than demand at certain price points and in certain locations, resulting in a home price correction.
Payment-to-income ratio out of whack. Related to affordability, the payment-to-income ratio is one of the most underappreciated factors determining where prices could go. For example, some of the Western markets that have seen price corrections have also had tight inventory and low unemployment rates, two conditions that are generally seen to make a market correction-proof. What these markets have in common is a stretched payment-to-income ratio. The stretched ratio, and, by default, consumers, contributed to a price correction despite the strong macroeconomic environment.
Beyond the aforementioned price drivers, consumer confidence plays an important role to the upside and downside as well. We saw rapid growth when consumers had a FOMO mindset, or fear of missing out, and a sharp slowdown as consumers shifted toward FOBATT, or fear of buying at the top. It seems the consumer mindset is a bit more neutral today, with those buying for life stage or lifestyle reasons are still active while others have chosen to sit on the sidelines for now.
Zonda’s 2023 national home price forecast is a range between flat to down 3%, but if we’ve learned anything over the past few years, it’s how quickly the market can change. Tracking metrics on the economy, inventory, and confidence will help provide real-time information of how the market evolves.